
- Introduction
- Intra VPC traffic Analysis from traceflow with VPC Role.
- Intra VPC Packet capturing with Enterprise admin rights.
- Conclusion
Introduction
In the second part of this study, we aim to provide a comprehensive understanding of the functioning of Virtual Private Cloud (VPC) networking. In particular, this post will address the various capture points that can be utilized to analyze East-West traffic at different levels, including the Virtual Network Interface Card (VNIC), switching, routing, Tunnel End Point (TEP) communication, and distributed firewall levels.
It is worth noting that VPC Administrators can perform traffic analysis from the source to the destination via the Graphical User Interface (GUI), provided they have the necessary rights. This approach enables the tracing of packet flow in a GUI format with a timestamp. Additionally, we will delve into how to capture packets through the Command Line Interface (CLI), allowing for a comparison of each packet flow with the GUI trace flow.
By examining VPC networking from this perspective, we hope to provide readers with a deeper understanding of the different capture points and how they can be utilized to analyze East-West traffic. This knowledge can be invaluable for VPC Administrators seeking to optimize network performance and security.
I am pleased to provide you with detailed explanations of these topics.
- Intra VPC traffic Analysis from traceflow with VPC admin rights.
- Intra VPC Packet capturing with Enterprise admin rights.
- Conclusion.
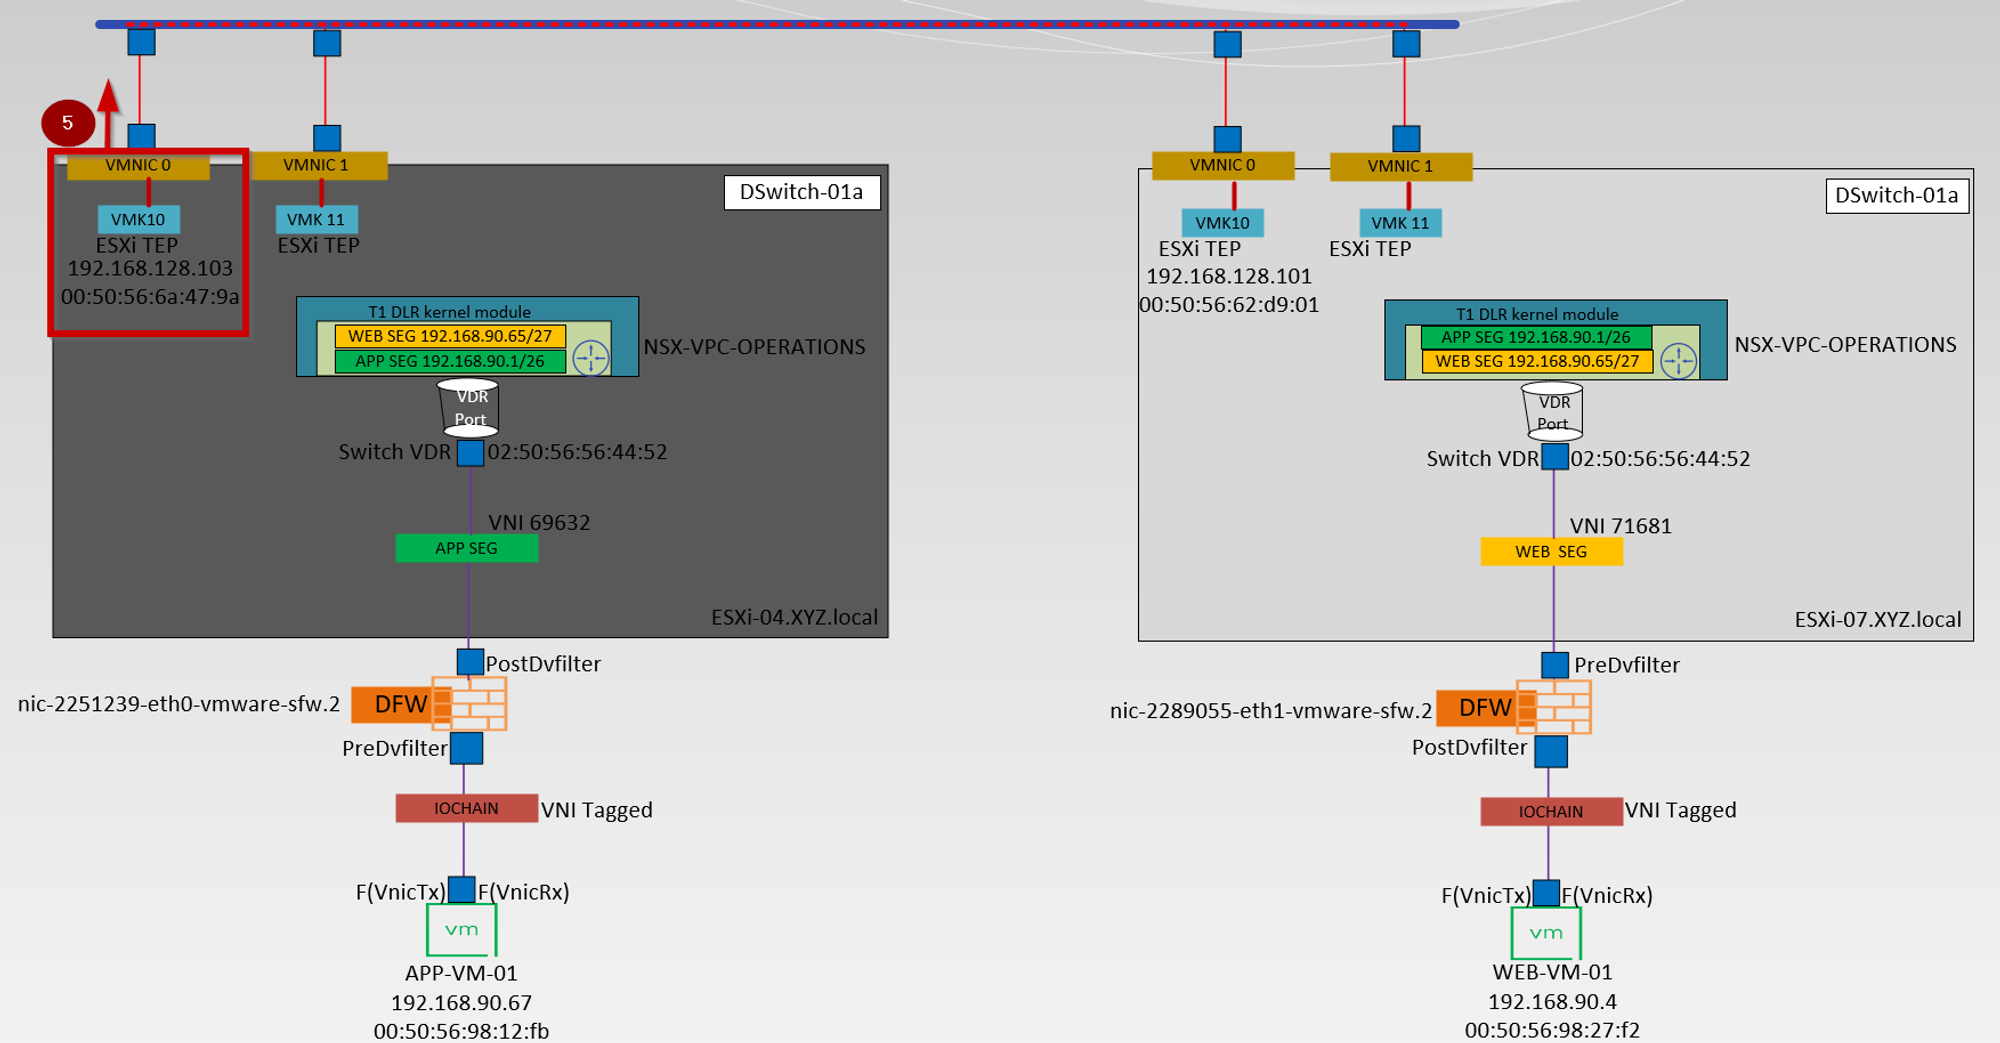
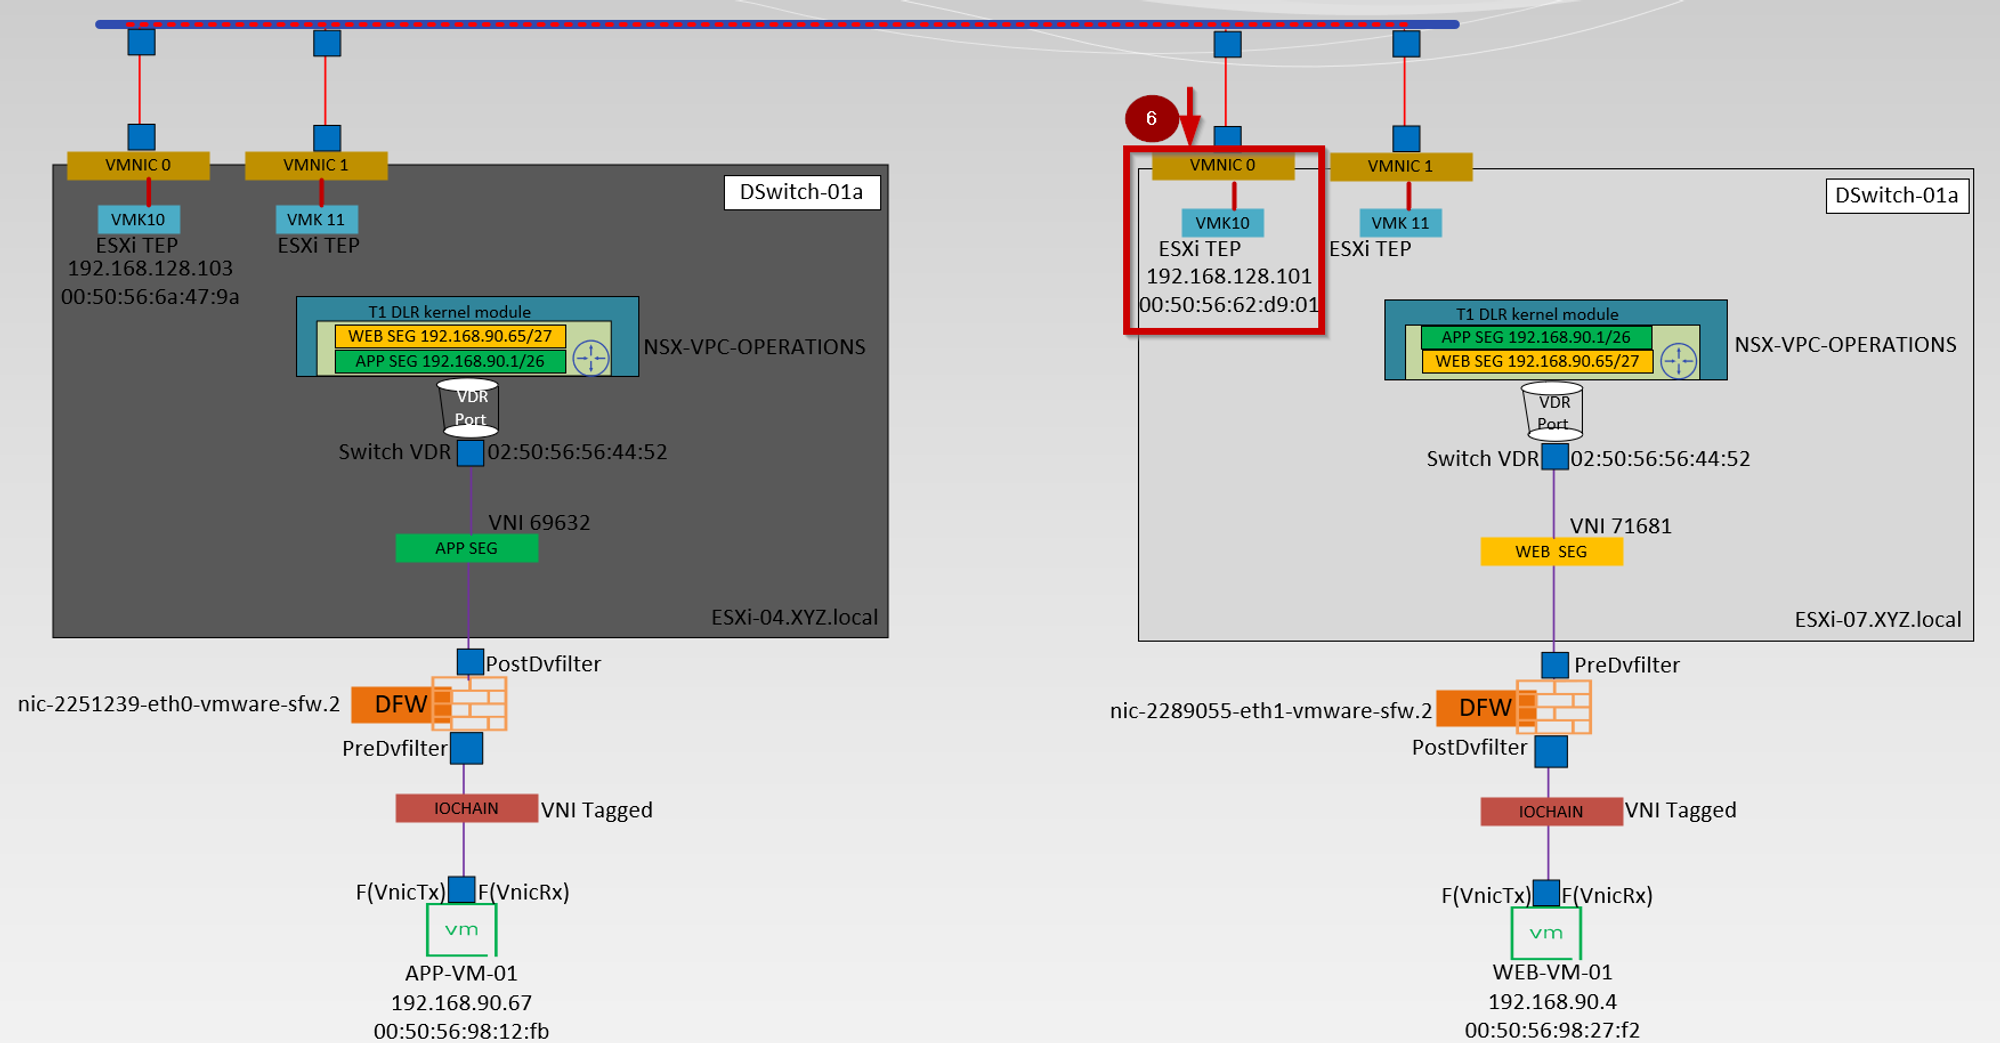
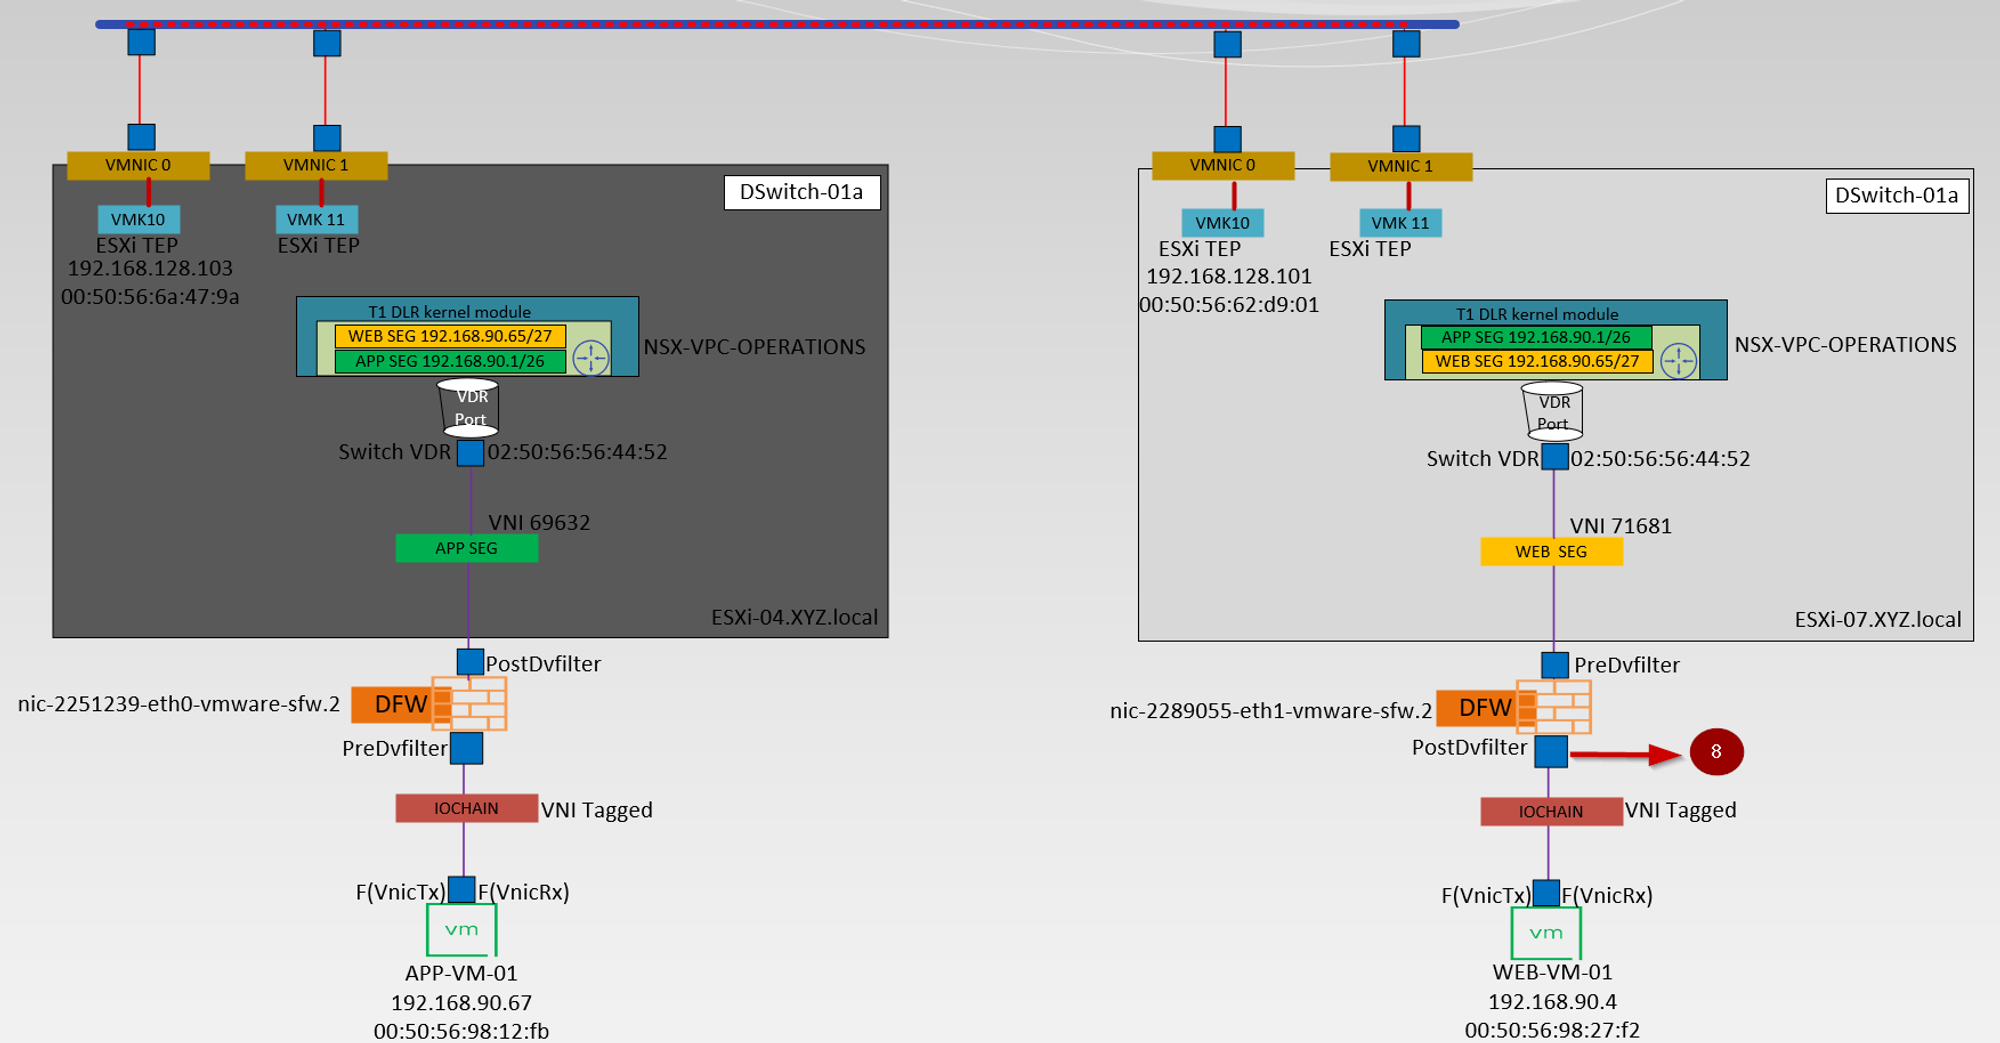
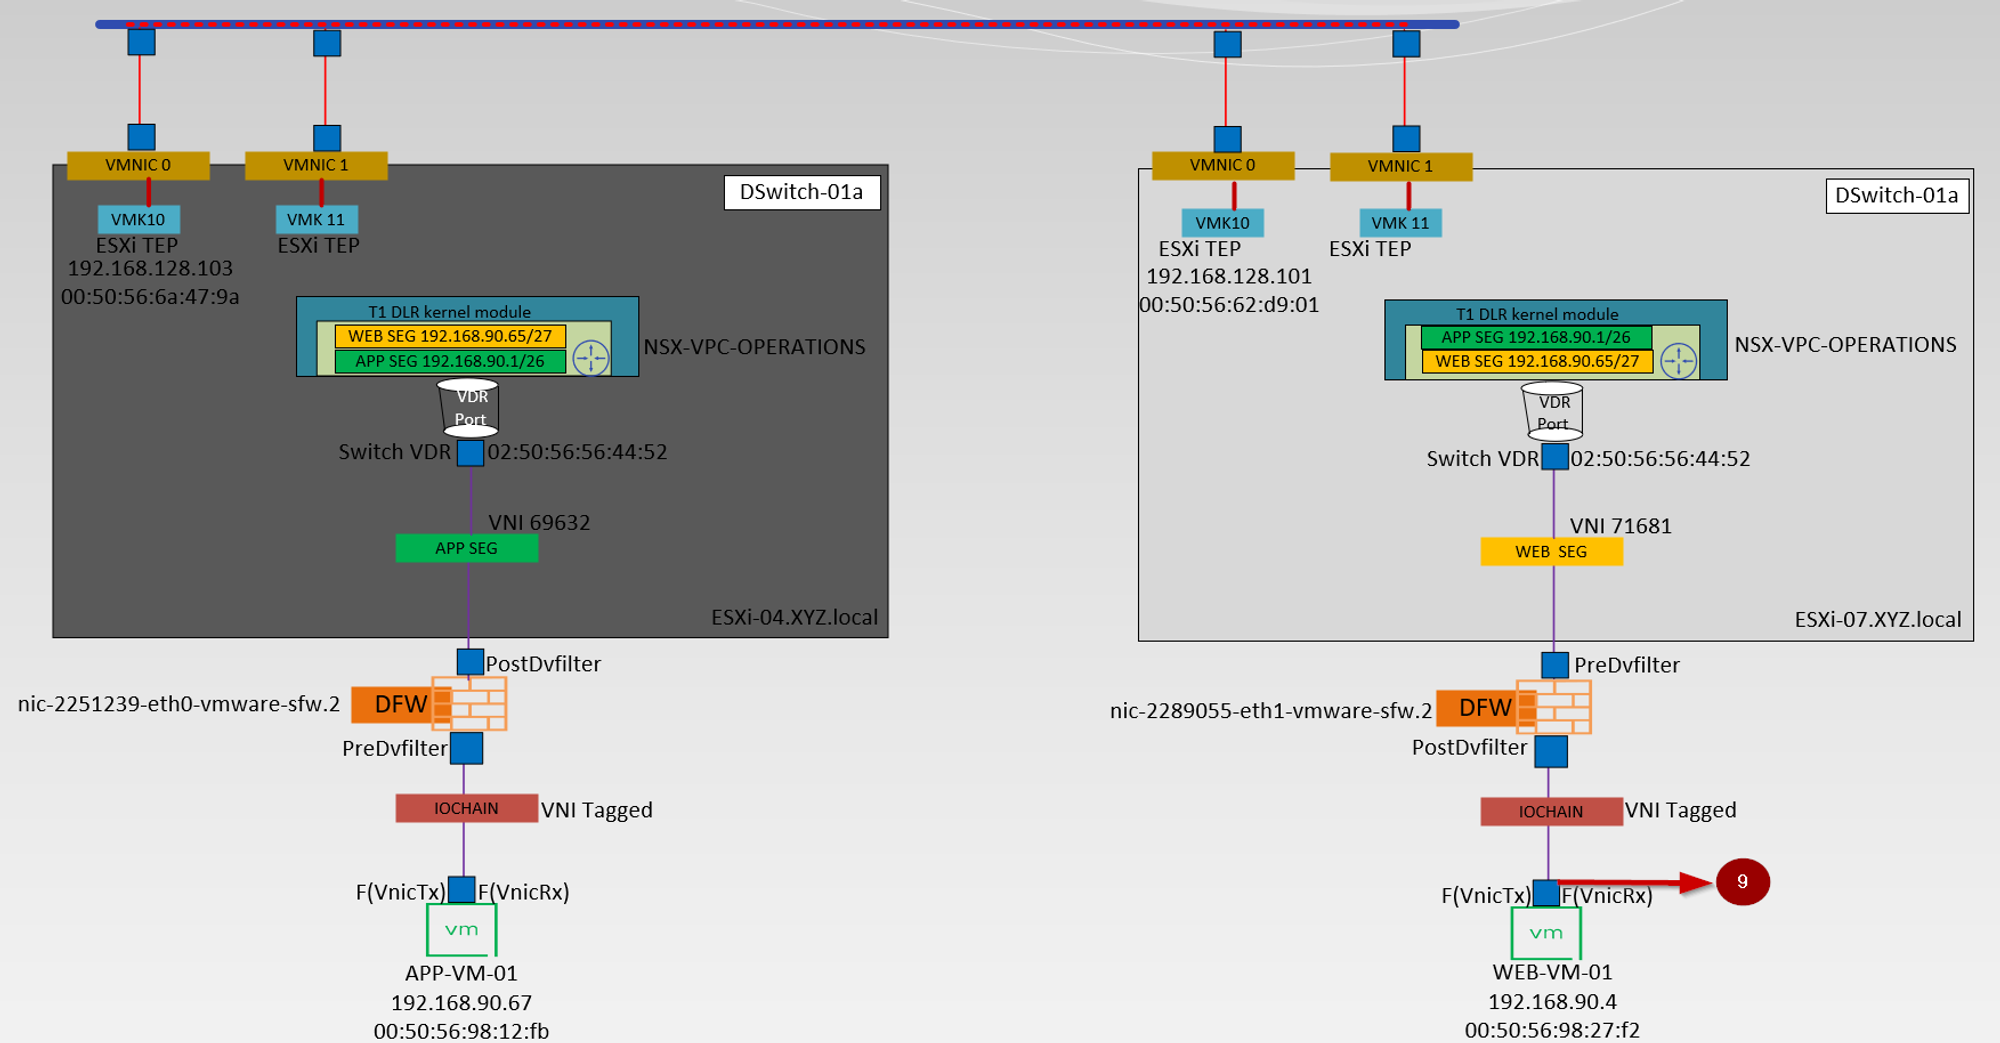
Below is the high-level topology we are referring to simulate in this blog.
Capture 1:-

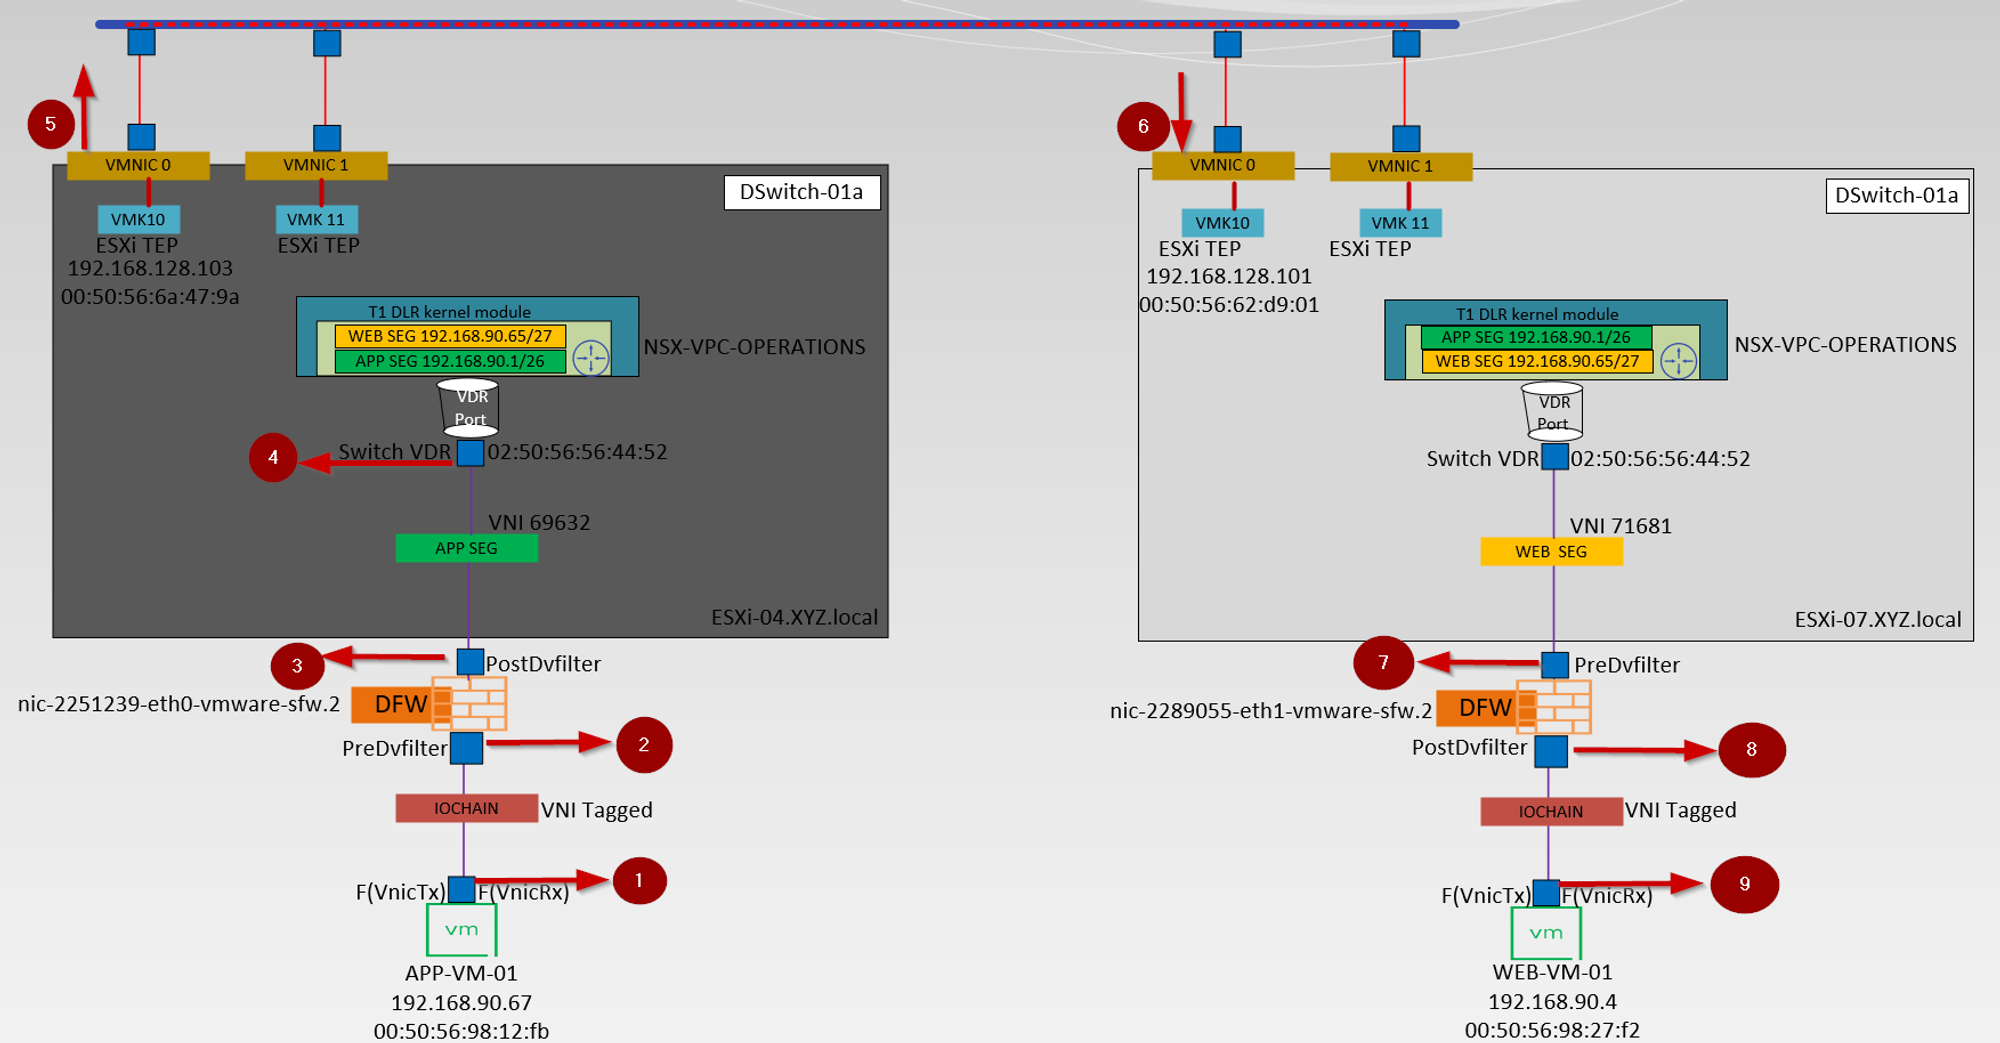
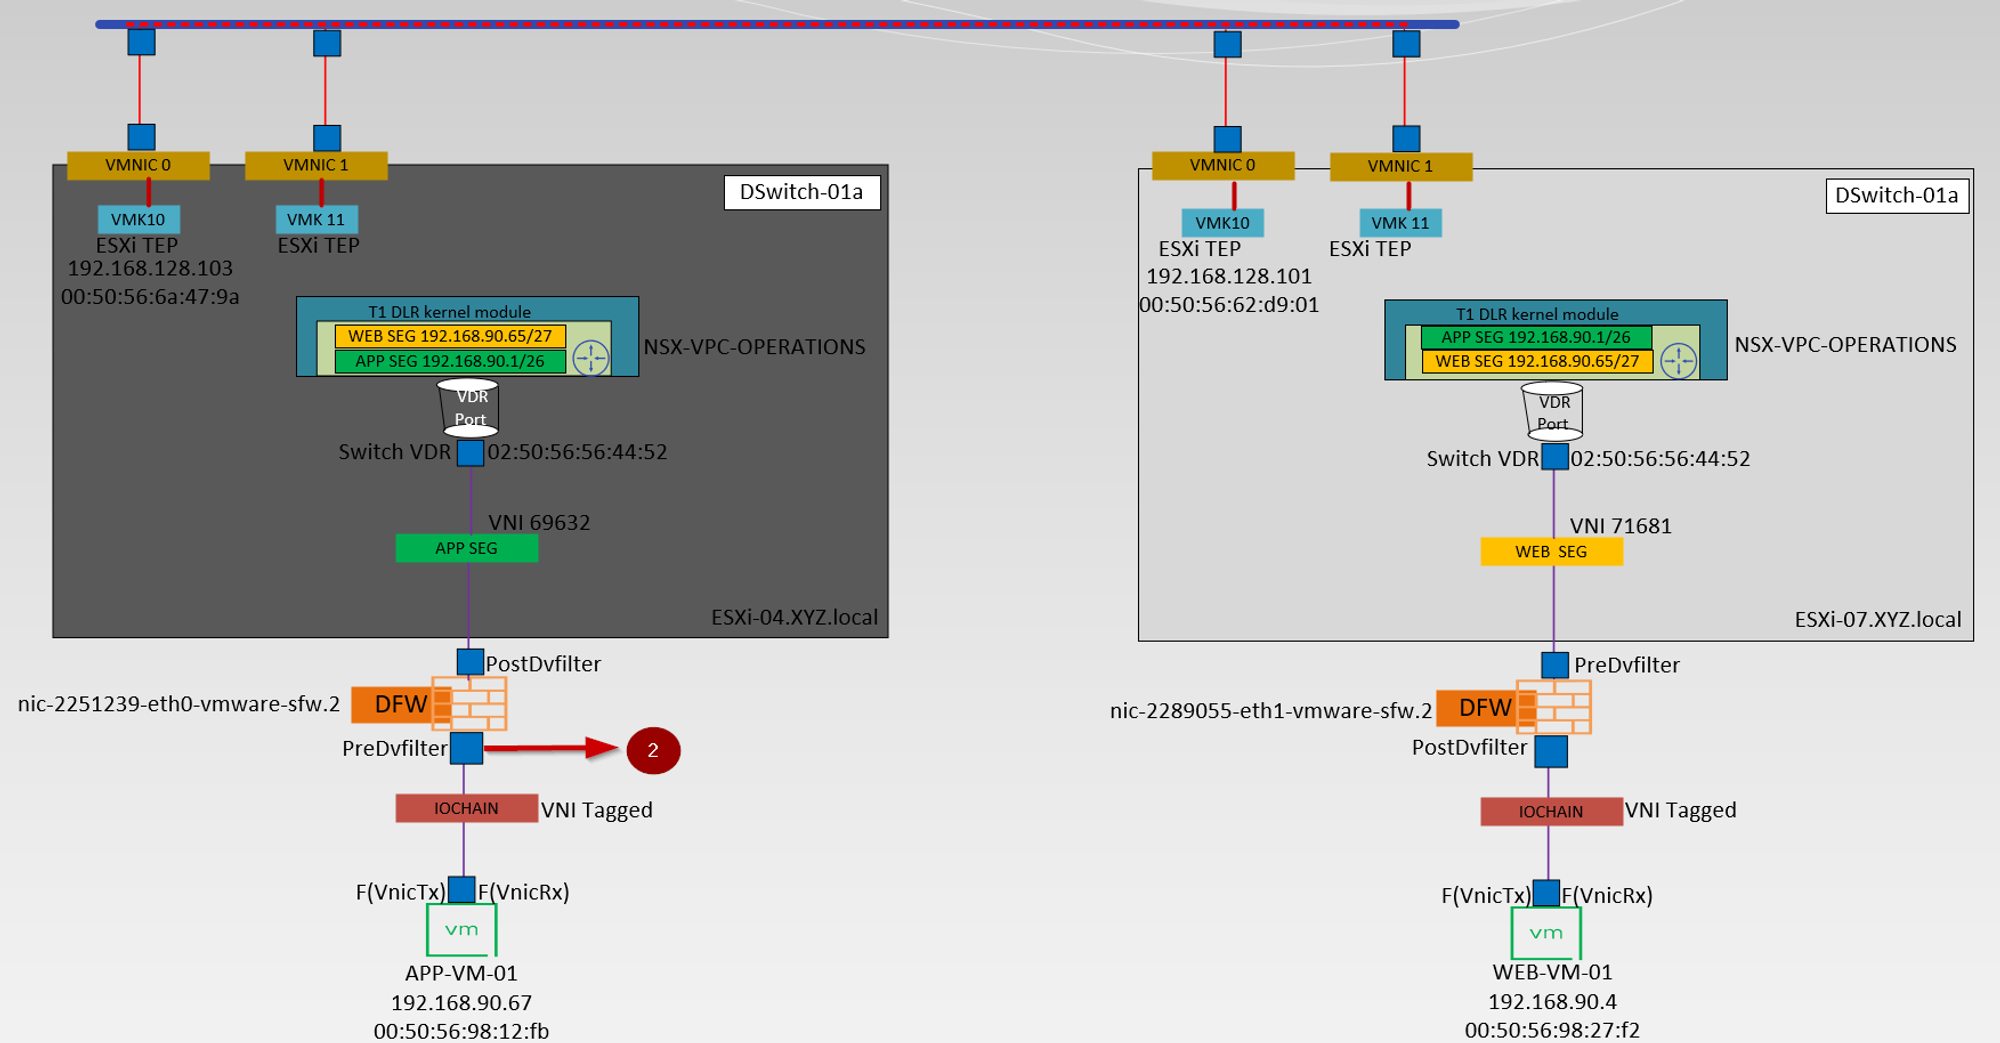
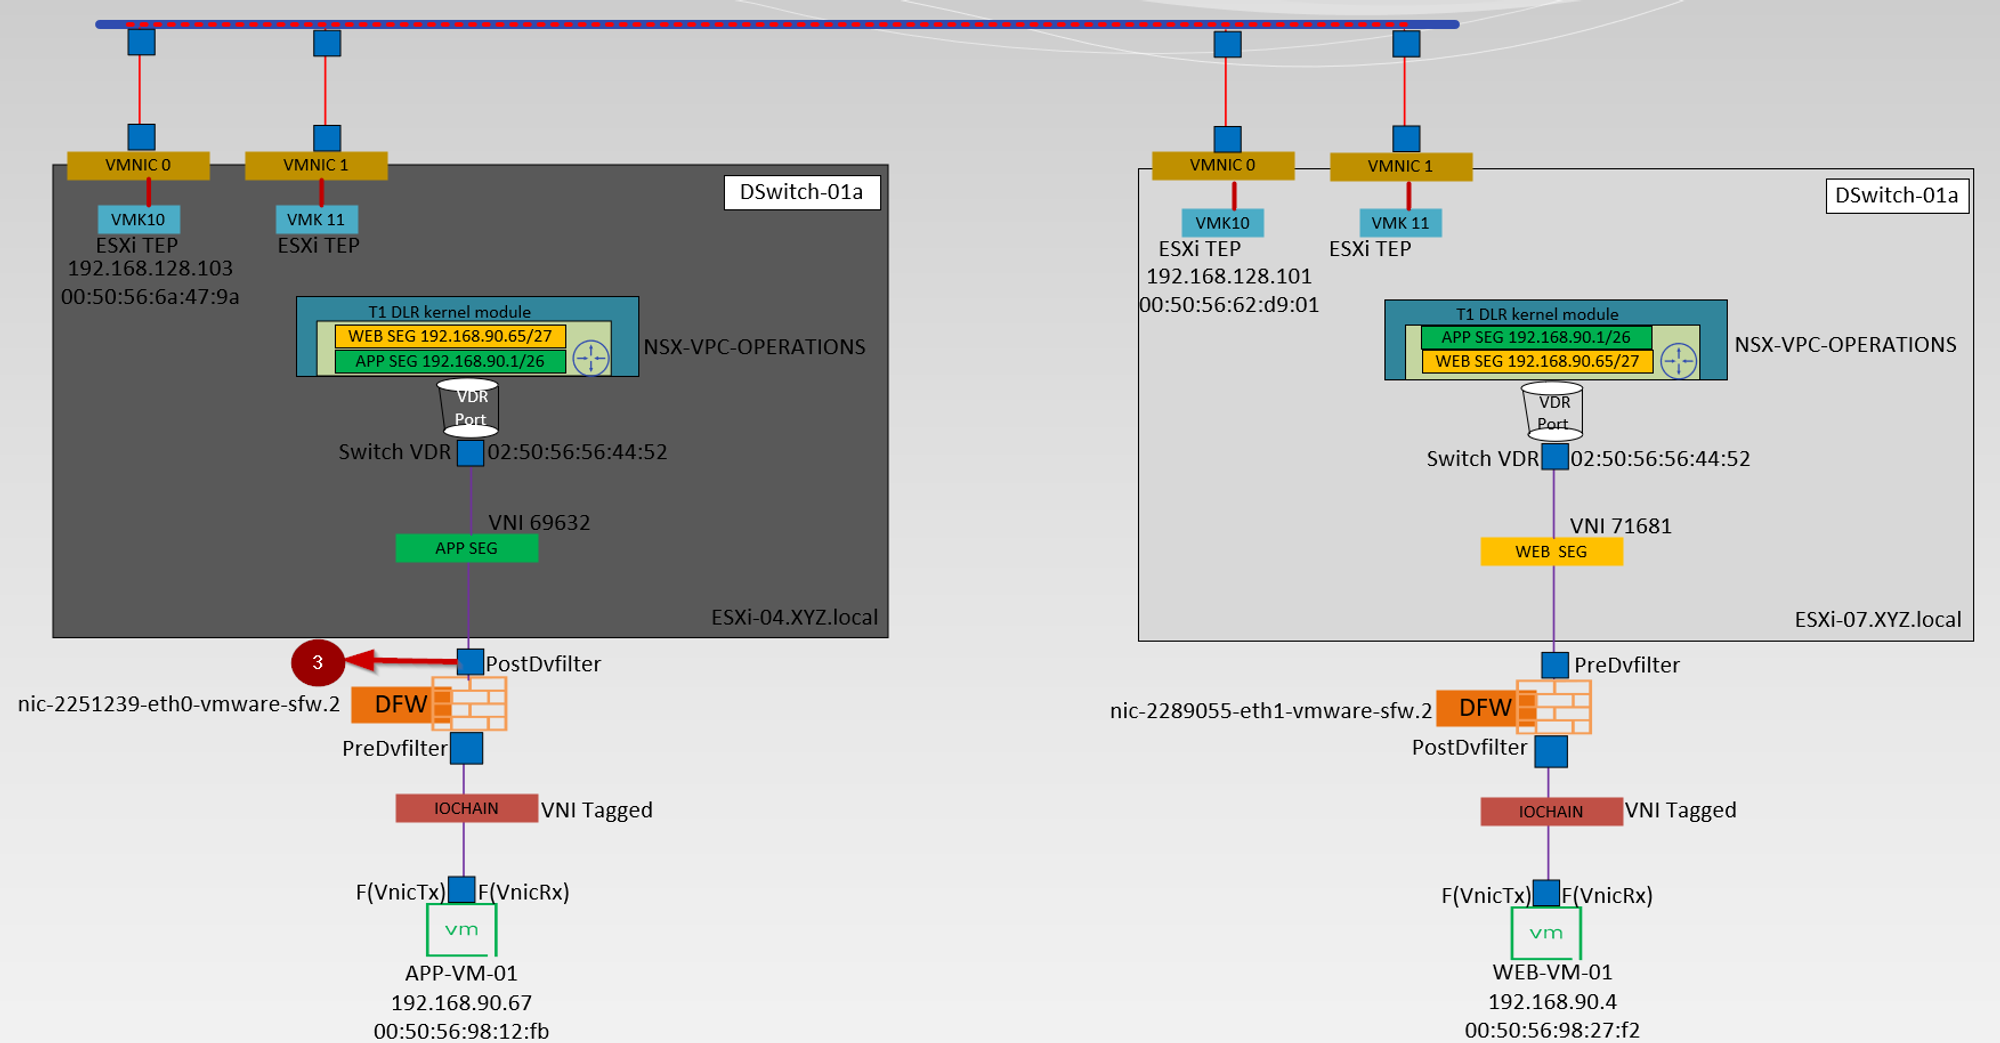
Brief information about the topology
- APP-VM-01 is the source VM on the host ESXi-04.corp.local. We will ICMP the destination VM Web.VM-01 on the Host ESXi07.corp.local. We will capture the traffic at the vNIC of the source VM.
- IO Chain -here is the VNI tagged.
- We will capture the traffic at the Predvfilter level so we can get the info before the firewall rule is processed.
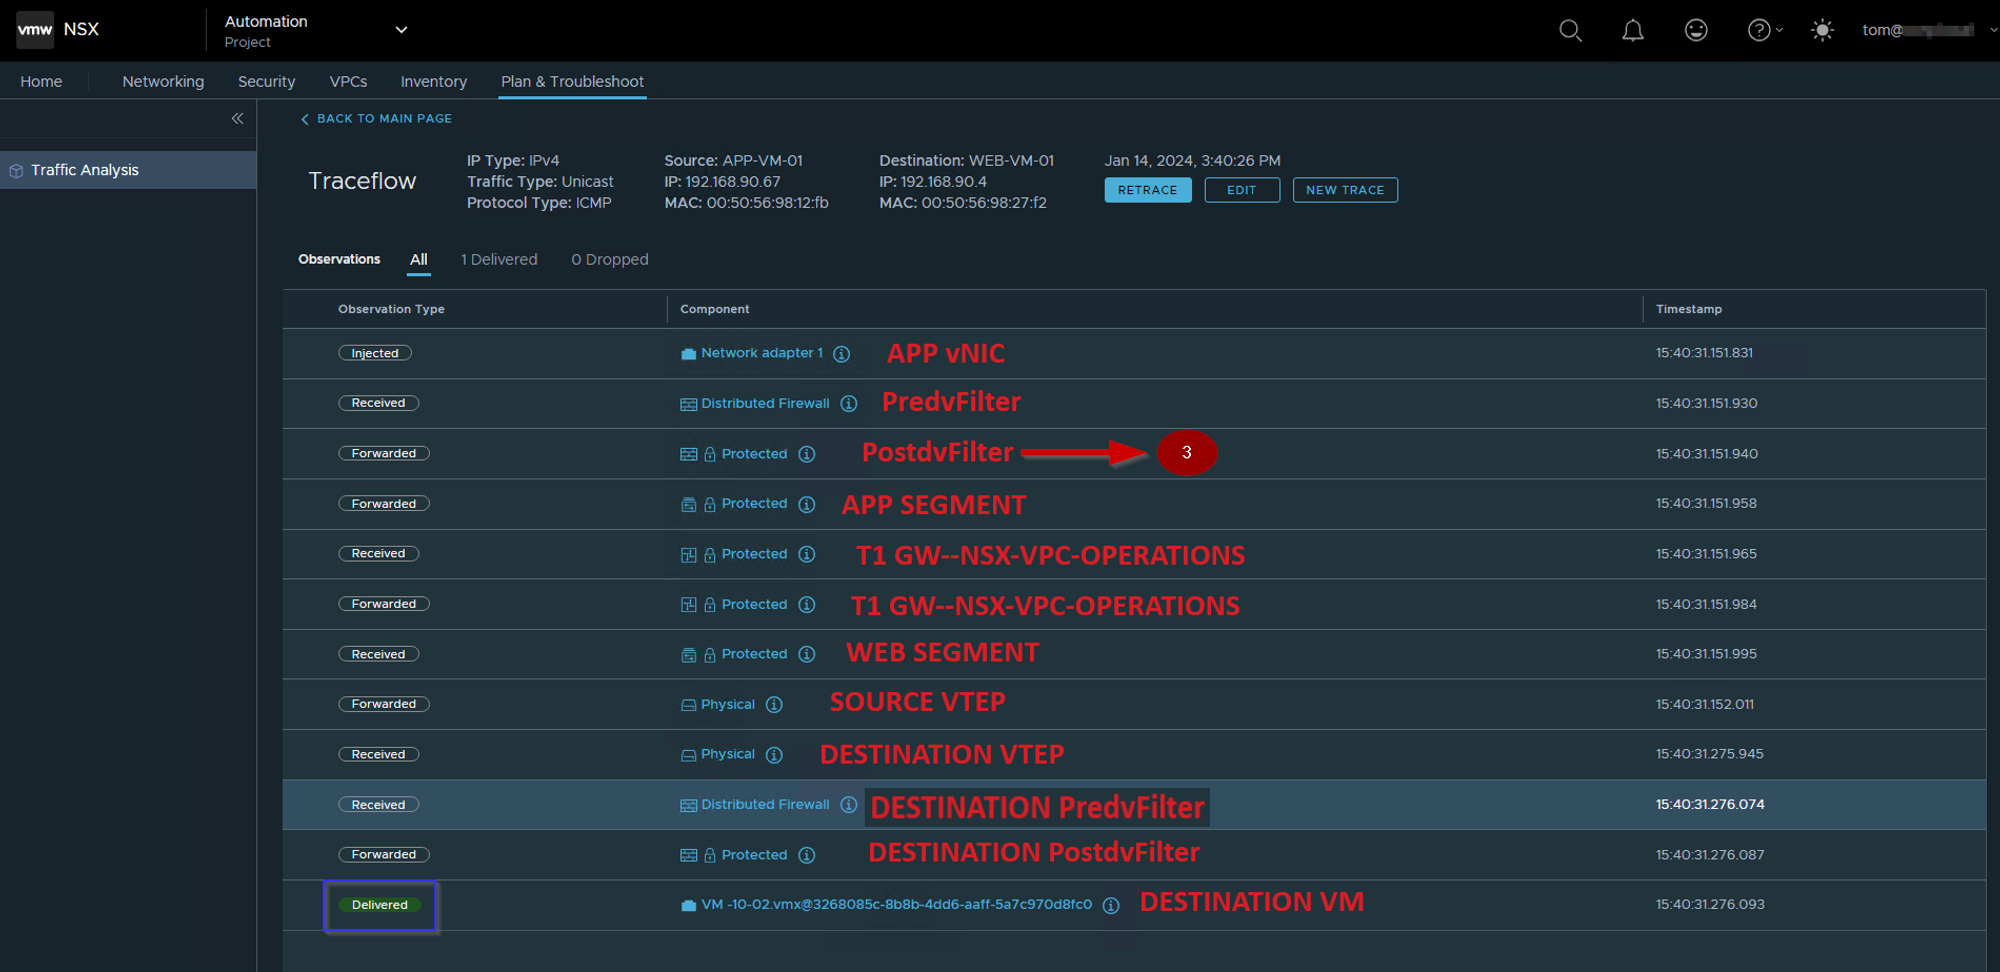
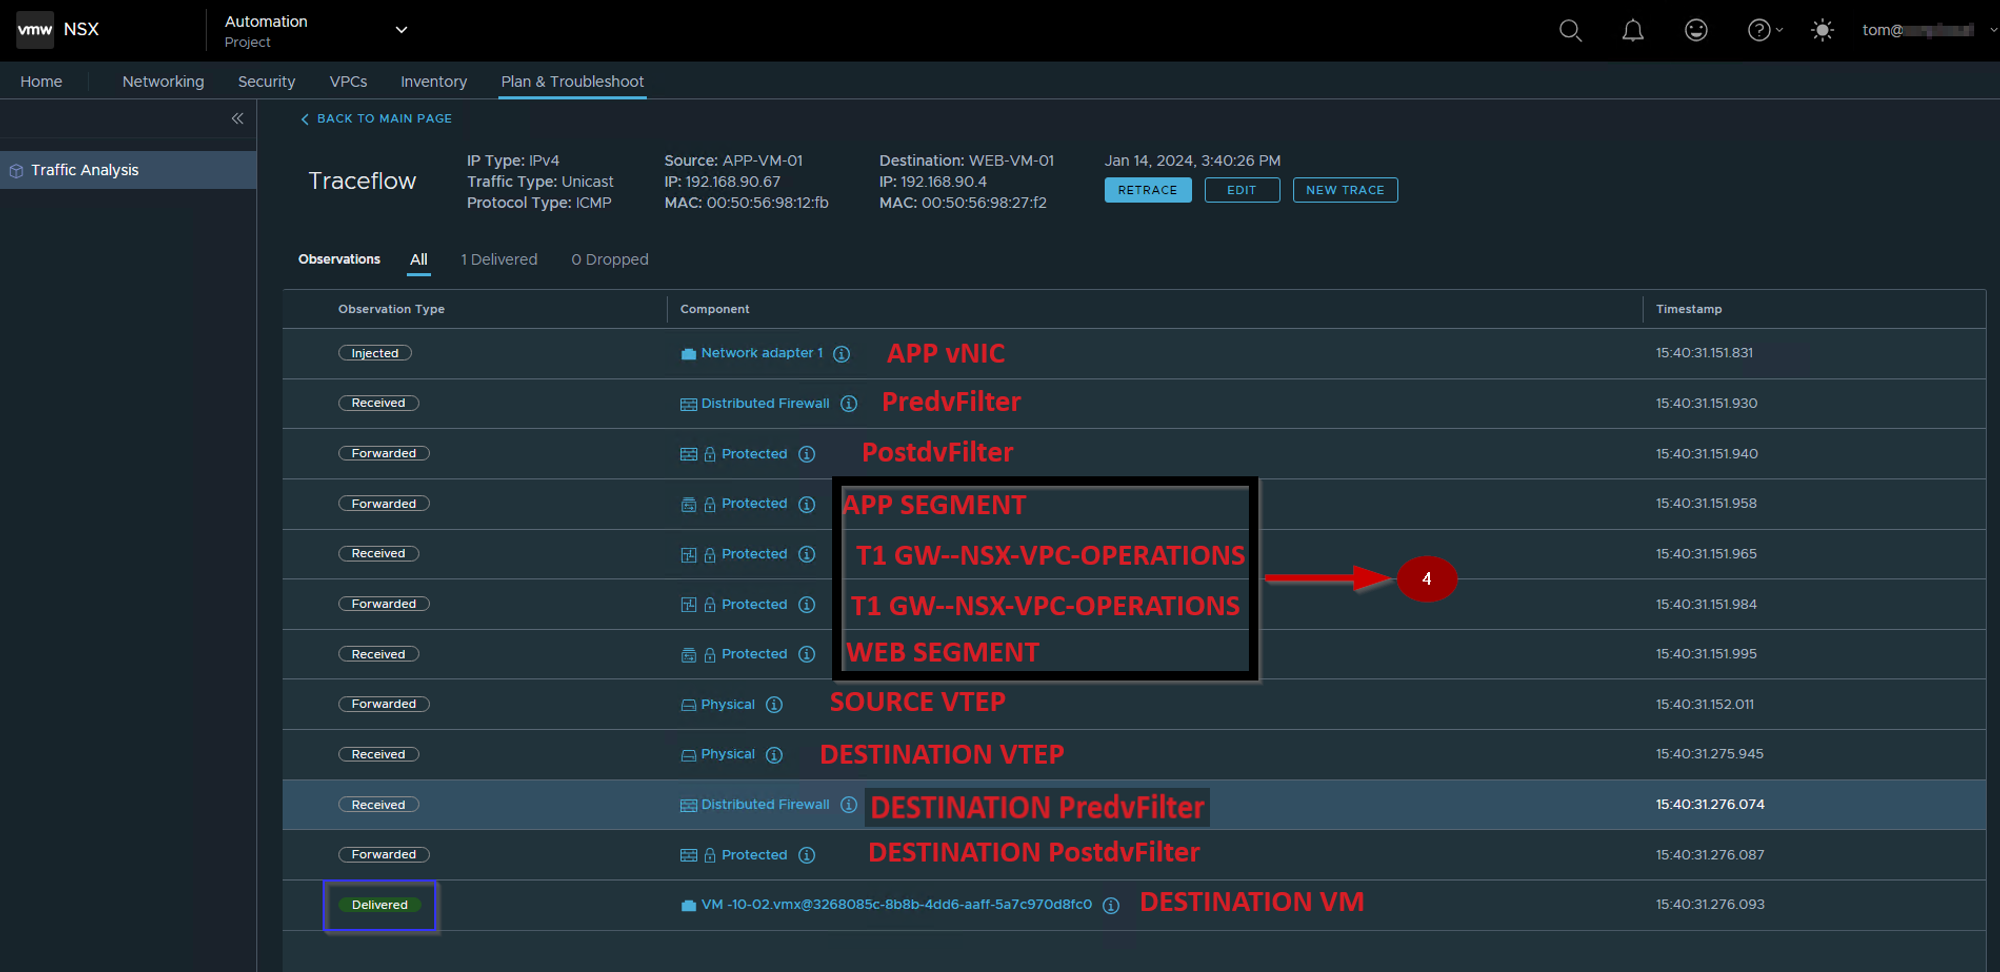
- Post DVfilter level we will get a confirmation about the Firewall rules are enforced on the datapath Traffic. After the confirmation of enforcement, the traffic leaves from Source Segment (APP-SEG) to T1 Gateway or we can say switch VDR port.
- Source (APP-SEG)and destination segments(WEB-SEG) are connected to the same T1 Gateway (NSX-VPC-Operations. Due to the Distributed architecture of the T1 gateway the MAC address of the VDR port(02:50:56:56:44:52)is the same on the source and destination host. vdr Port will confirm the traffic is processed at the T1 Gateway DR component.
Note:- T1 Gateways in VPC are auto-created. - The Source ESXi TEP VMK 10 (192.168.128.103) encapsulates the traffic with Geneve encapsulation and sends i to destination ESXi TEP via source uplink(physical adaptor) vmnic0.
- The Destination transport node receives the traffic from the underlay network on the physical adaptor (uplink)vmnic0. Bound VMK10 (192.168.128.101) with uplink vmnic0 decapsulate the traffic and forward it to the WEB-Segment to which the destination VM is connected.
- In this stage, the investigation is started by the DFW. Now DFW will check in the firewall rules does this incoming packet is allowed from APP to WEB. Postdvfilter and Predvfilter will perform this task.
- Now the packets are delivered to the destination VM (WEB-Vm-01)
Intra VPC traffic Analysis from traceflow with VPC Role.
Capture 1: –
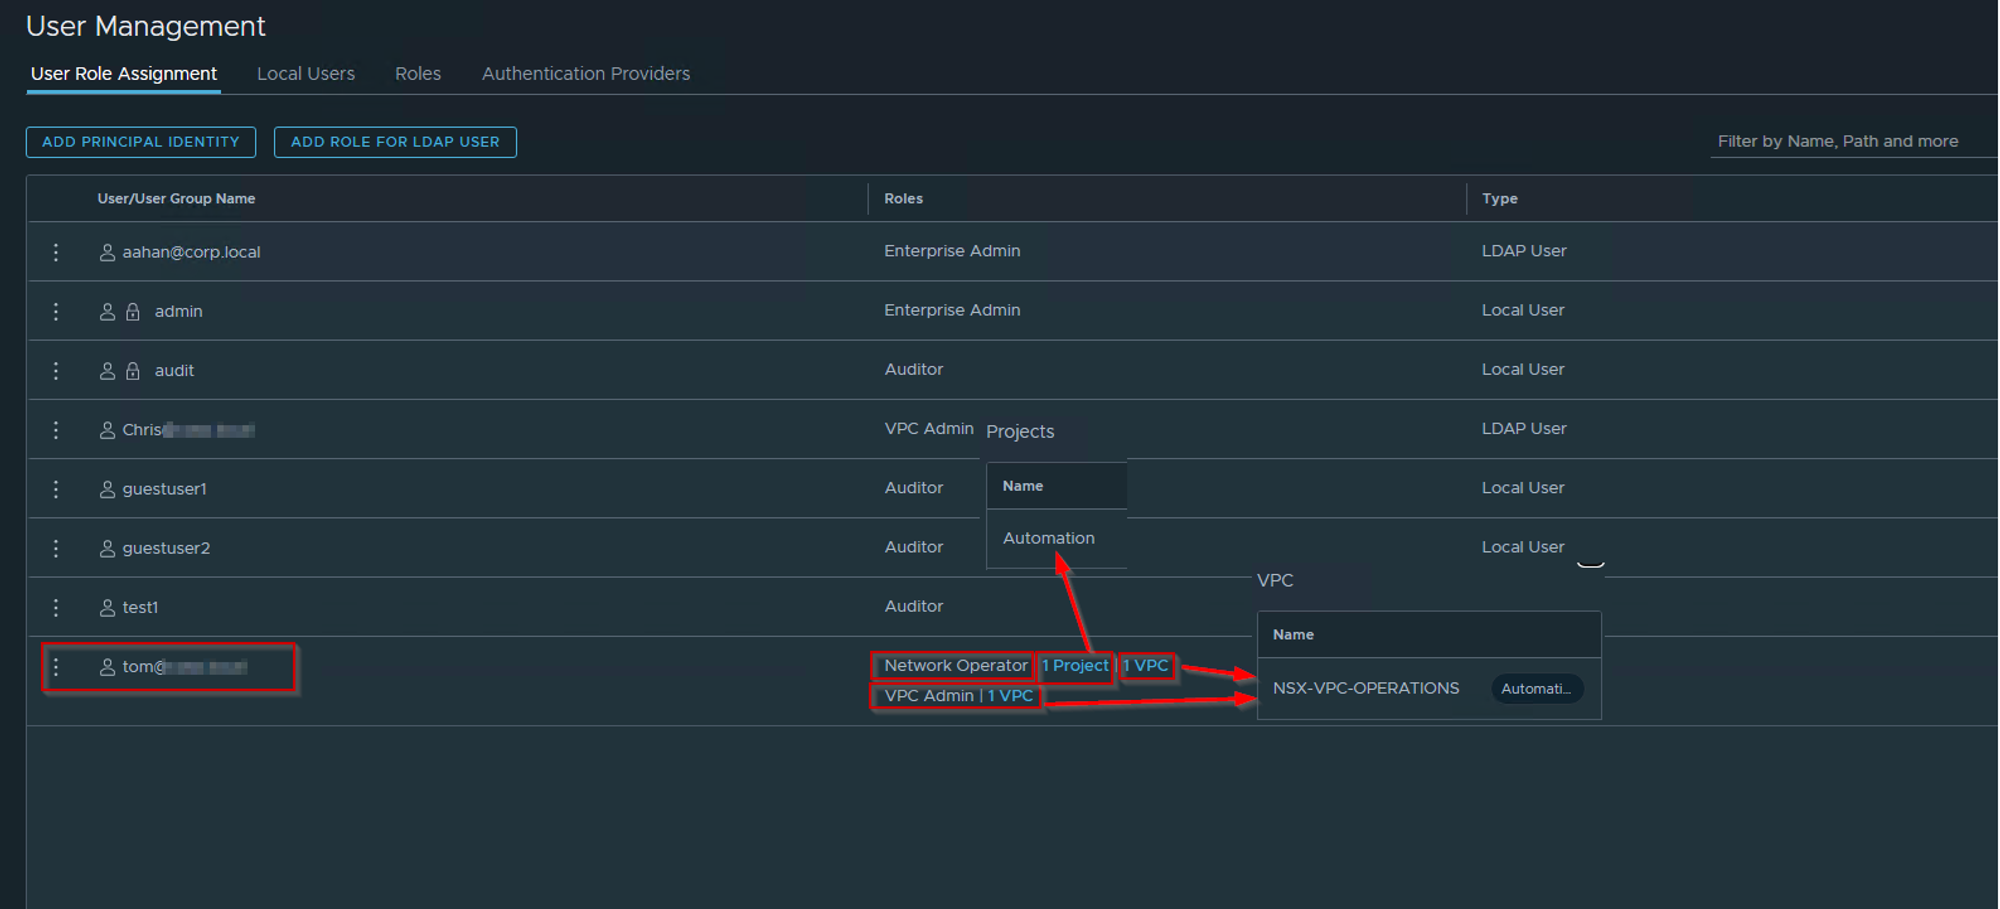
TOM user is associated with Project Automation and also is a part of NSX-VPC Operations.
He is associated with 2 roles network operator & VPC admin. As per the high-level topology, we need to traceflow with the VPC rights user. The network operator role will give the right to TOM so he can perform the traceflow. The VPC Admin role doesn’t have a traceflow feature.
Traceflow is a good tool for analyzing the EAST/WEST or NORTH/SOUTH traffic flow.
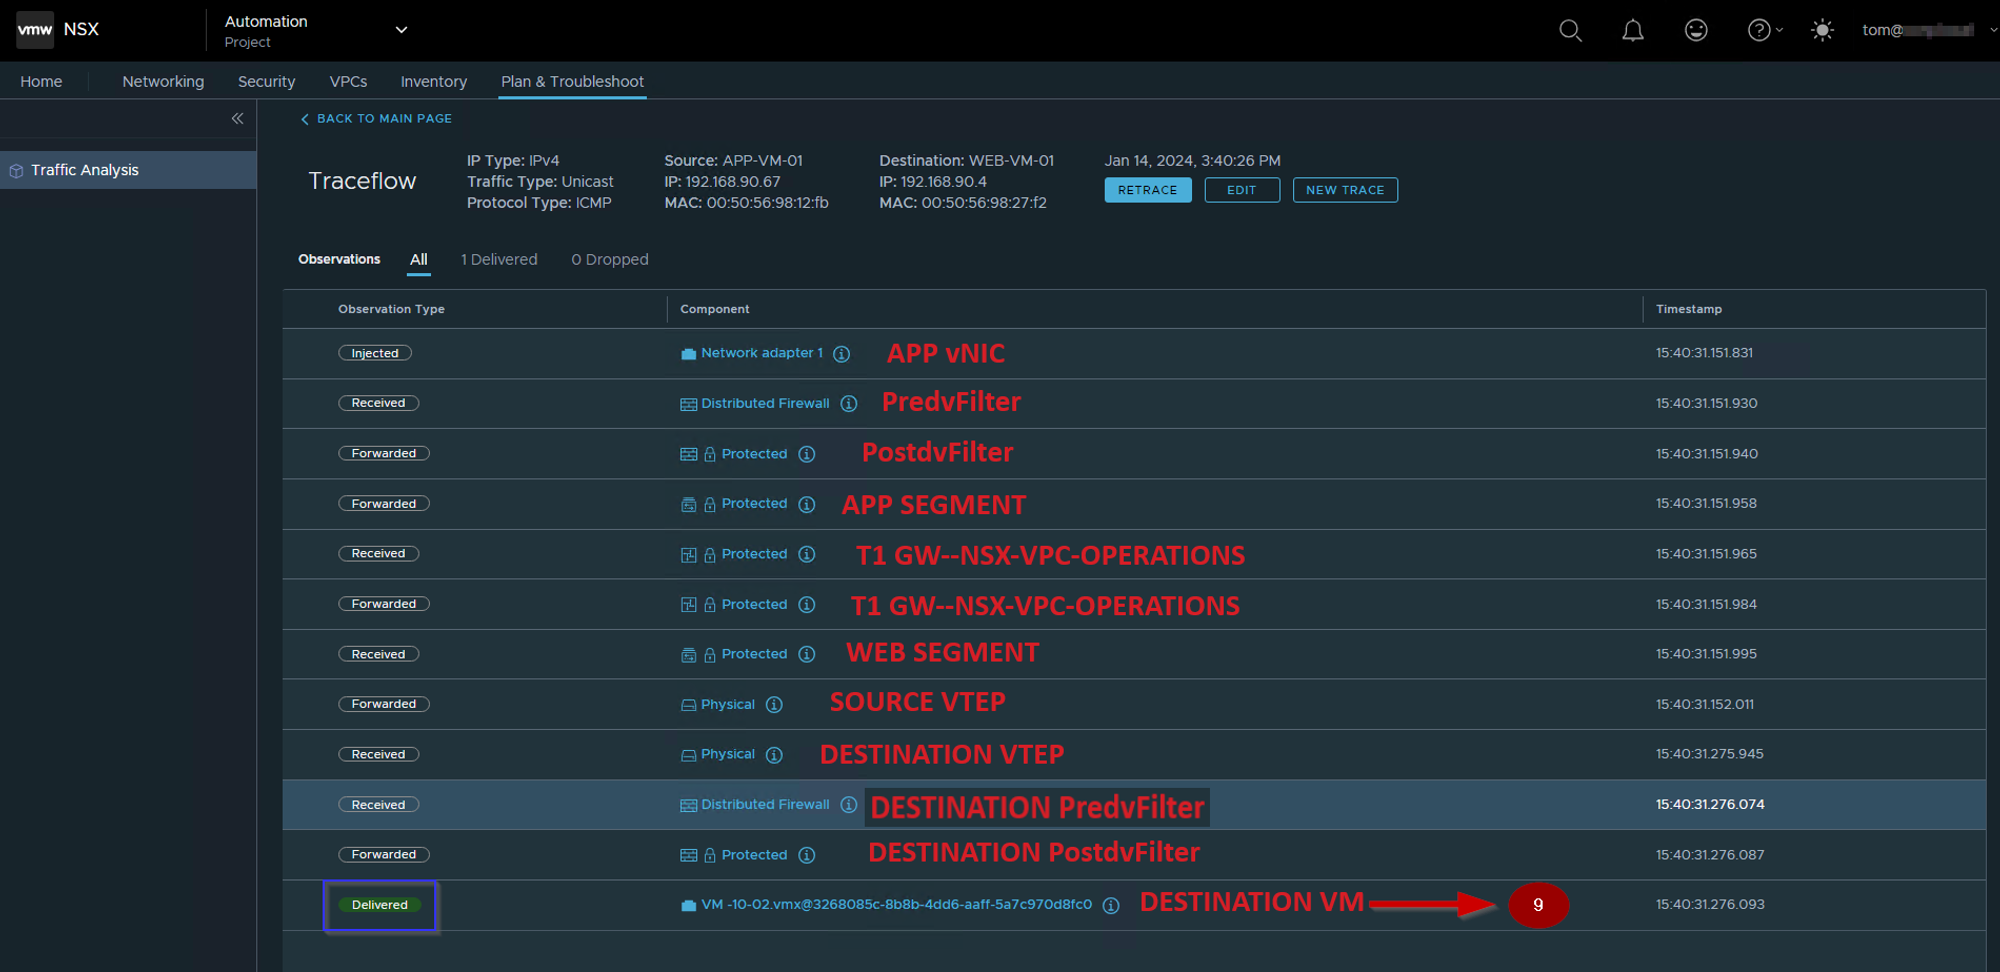
Capture 2: –
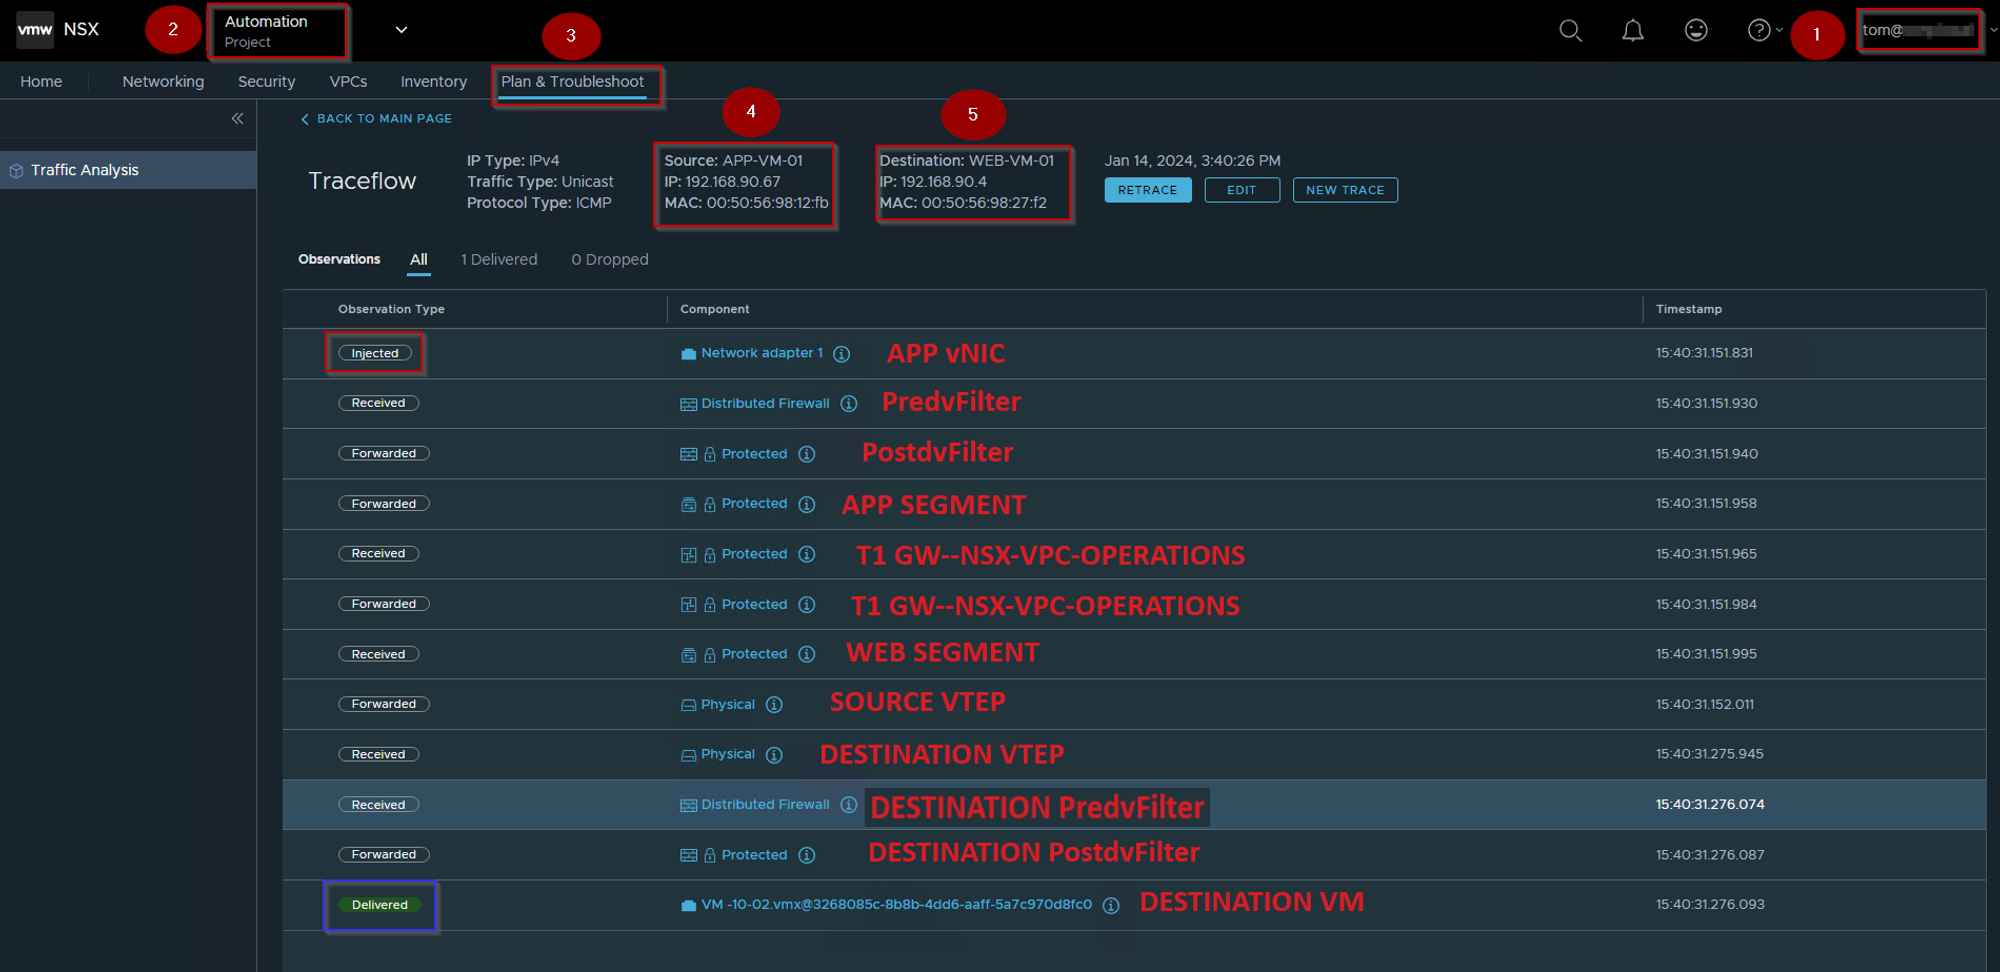
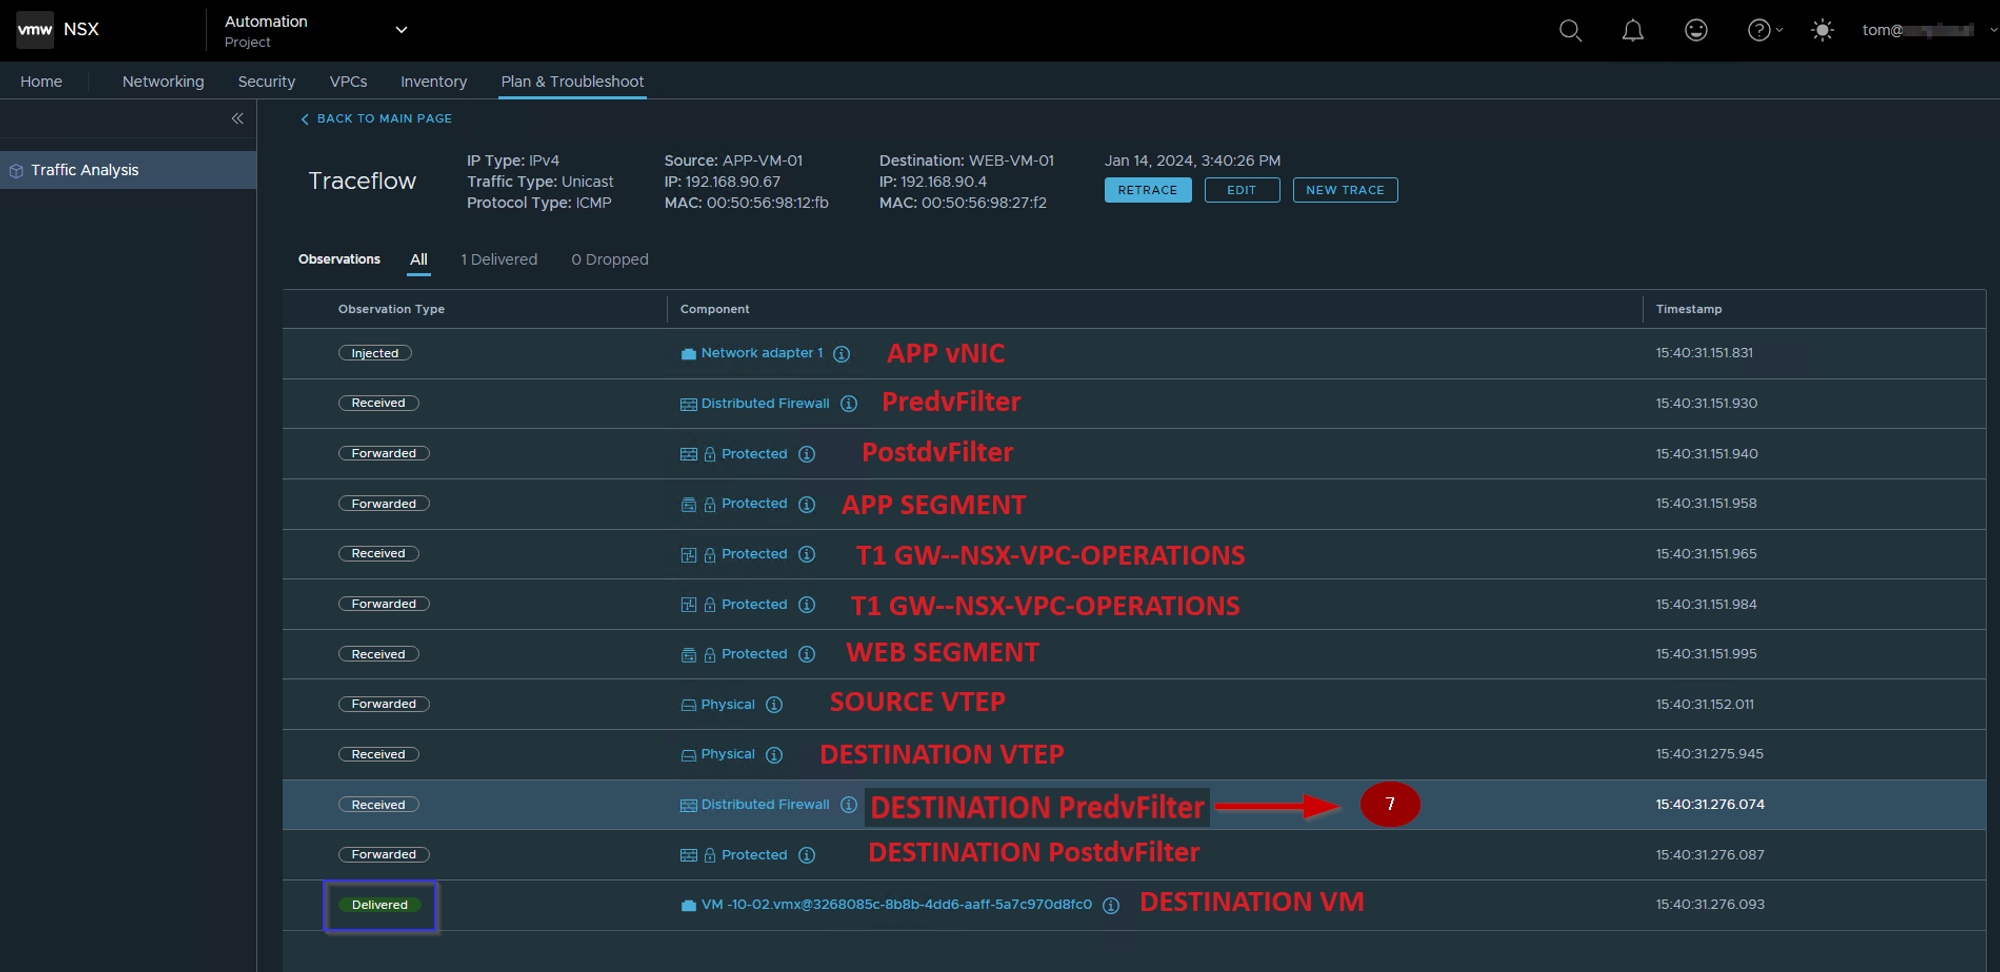
- Login with the VPC rights user. As per our topology, we will use the TOM@xyz.local user.
- Click on the drop-down and select the project.
- Click on Plan & troubleshoot & select the traceflow.
- Select the Source APP-VM-01.
- Select the Destination WEB-VM-01 and then click on the trace.
Note:- As per capture 2 we can see the ICMP packet from Source to Destination is delivered successfully.
Intra VPC Packet capturing with Enterprise admin rights.
As we know VPC ADMIN rights are restricted at the CLI level. Here we need to involve the enterprise admin rights user so we can capture the packet from the host transport node. let us live to capture the ICMP source to destination packets and compare them the capture 2 traceflow.
let me show you the capturing points, so this will help us to understand the East-West traffic flow path.
Capture 1: –
- vNIC of the source VM-APP-VM-01
- PredvFilter of the source VM–APP-VM-01
- PostdvFilter of the source VM–APP-VM-01
- vdrport on the source ESXi host-ESXi-04.xyz.local
- Source ESXi host uplink—ESXi-04—VMNIC0
- Destination ESXi host uplink—ESXi07-VMNIC0
- PredvFilter of the destination VM—WEB-VM-01
- PostdvFilter of the destination VM—WEB-VM-01
- vNIC of the destination VM—WEB-VM-01
Let us follow the capturing points and compare them with the traceflow.
- vNIC of the source VM-APP-VM-01
Capture 2: –

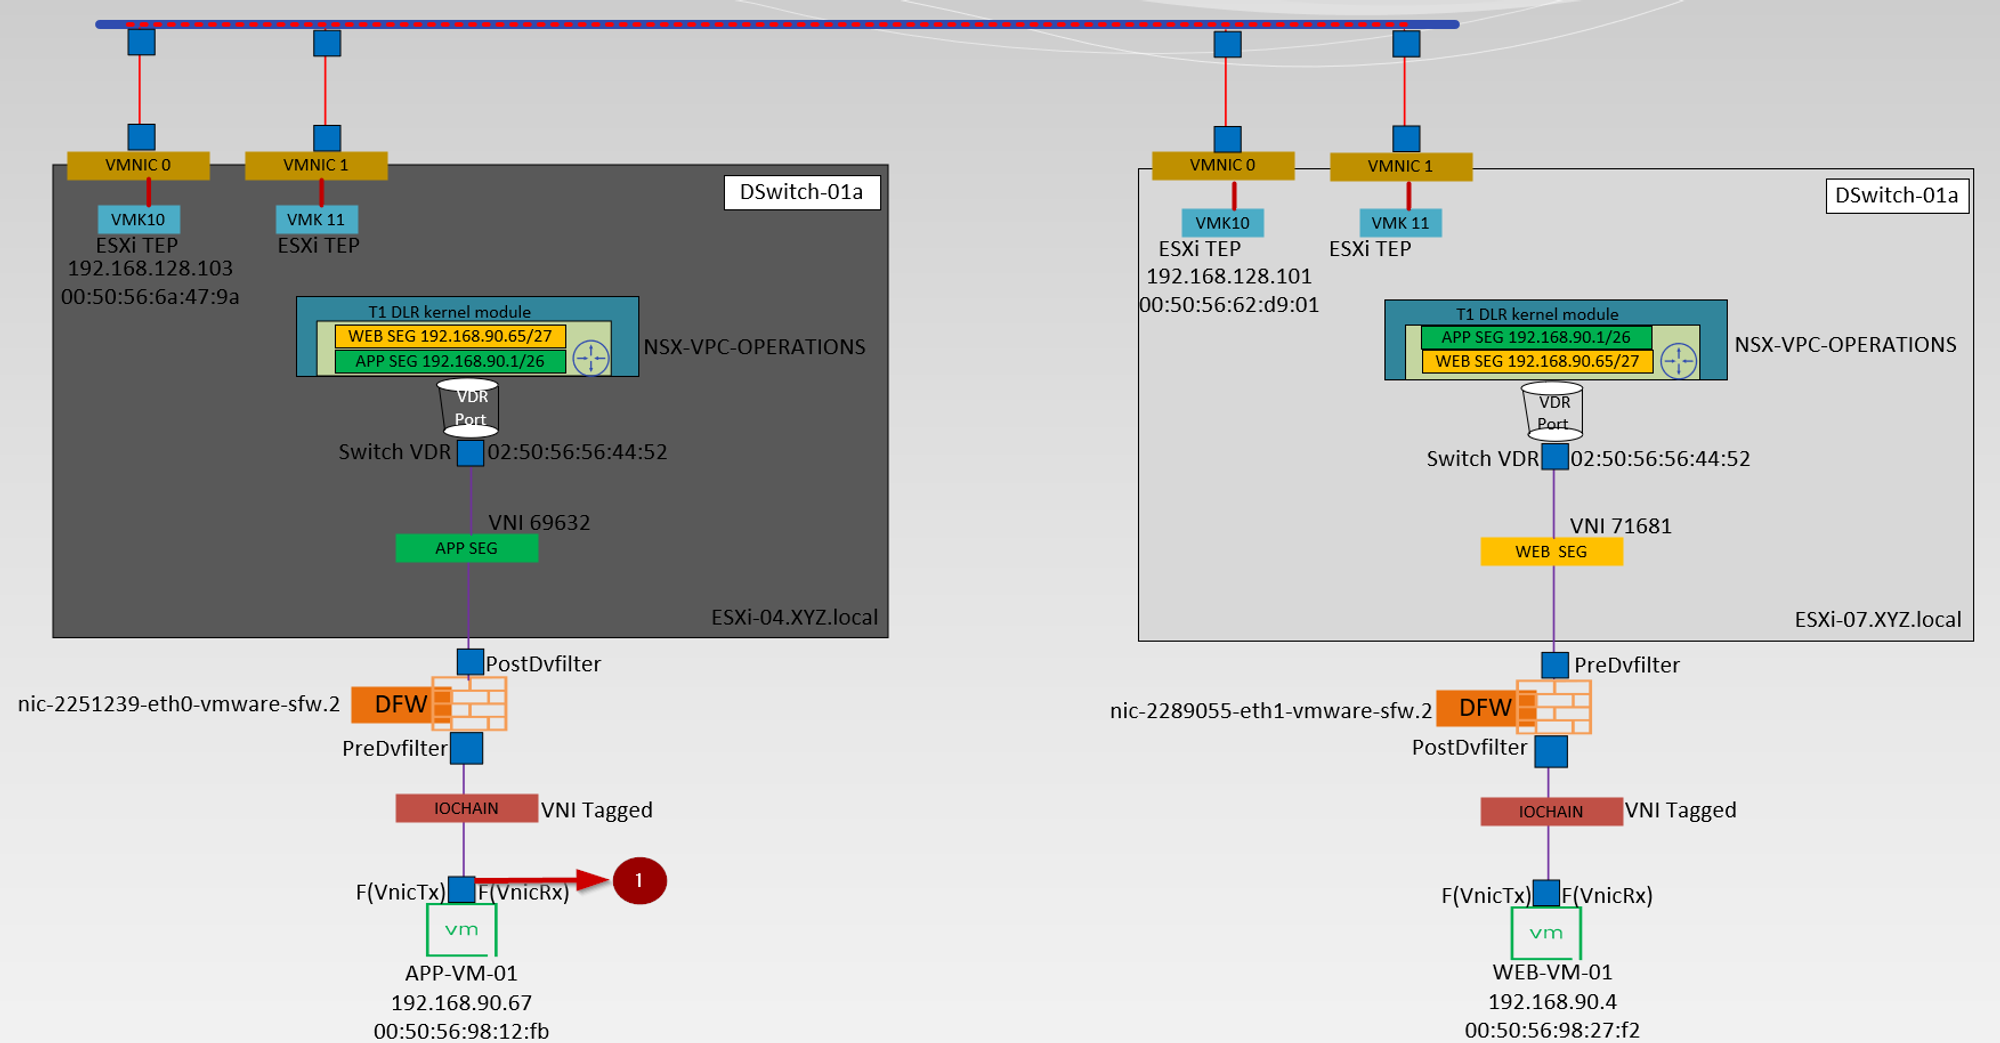
Step 1:- Finding the port number associated with the APP-VM-01

Step 1: – Use the NSXCLI cmd host transport node to access the NSX components.
Step 2:- “get ports” cmd on the nsxcli will provide us the Source VM and associated port number detail.
Step 3: – The below detail we require for packet capturing
Client name: – APP-VM-01.eth0
PortNum: – 67108887
Now we have the client name to capture the packet of vNIC of the Source VM.
Source VM vNIC level packet capturing: –
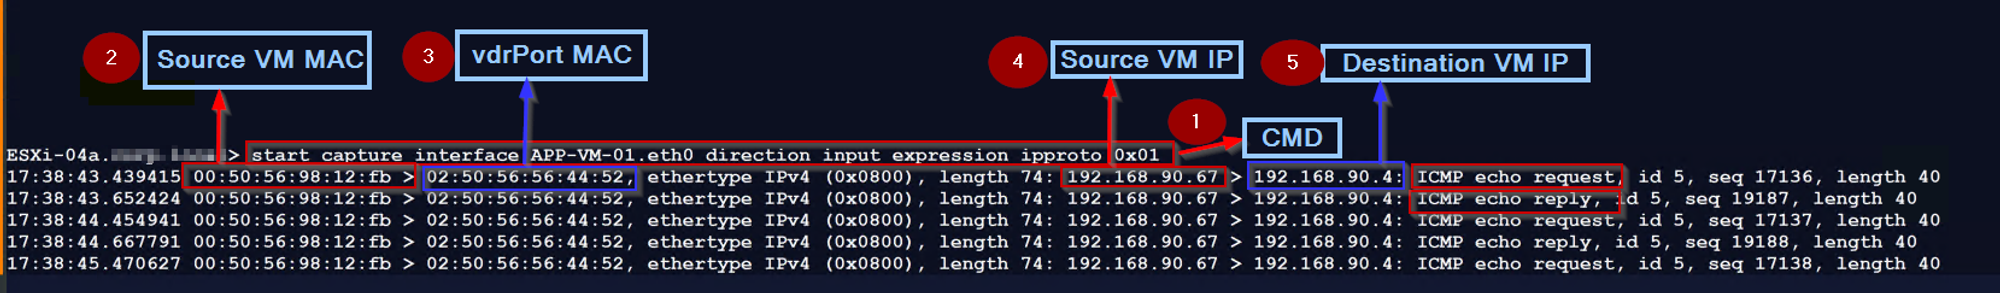
Step 1: – Use the below cmd to capture the vNIC traffic of the source VM.
start capture interface APP-VM-01.eth0 direction input expression ipproto 0x01
this cmd means we are capturing an entering switch port traffic of the source VM vNIC.
Step 2: -We captured the Source VM MAC—00:50:56:98:12:fb.
Step 3: – vdrPort MAC is the Destination MAC address—02:50:56:56:44:52.
Step 4: – Source VM IP — 192.168.90.67.
Step 5: – Destination VM IP —- 192.168.90.4.
IOChain: –
Upon establishing connection between a virtual machine and a Logical Switch in a virtualized environment, multiple security services are initiated to ensure data integrity and protect against potential threats. These security services are implemented as IOChains and processed within the vSphere kernel. Each packet transmitted between the virtual machine and the Logical Switch undergoes a thorough screening process via these IOChains, which offer varying levels of security measures against from Slot 0 to Slot 15. The IOChains are instrumental in ensuring that the data being transferred is secure and free from any vulnerabilities.
Slot 0: DVFilter – the Distibuted Virtual Filter monitors ingress/egress traffic on the protected vNIC and performs stateless filtering and ACL.
Slot 1: vmware-swsec – the Switch Security module learns the VMs IP/MAC address and captures any DHCP Ack or ARP broadcasts from the VM, redirecting the request to the NSX Controller – this is the ARP suppression feature.
Slot 2: vmware-sfw – this is where the NSX Distributed Firewall resides and where DFW rules are stored and enforced (so firewall rule and connection tables).
Slot 3: reserved for future use by VMware
Slot 4-12: 3rd party services – this is where traffic is redirected to 3rd party service appliances
Slot 13-14: reserved for future use by VMware
Slot 15: Distributed Network Encryption (when it becomes available)
2:- PredvFilter of the source VM–APP-VM-01
Capture 3: –

In this step first, we find the dvfilter name of the Source VM and then we capture the PredvFilter on the source VM.
finding the dvfilter name of the Source VM
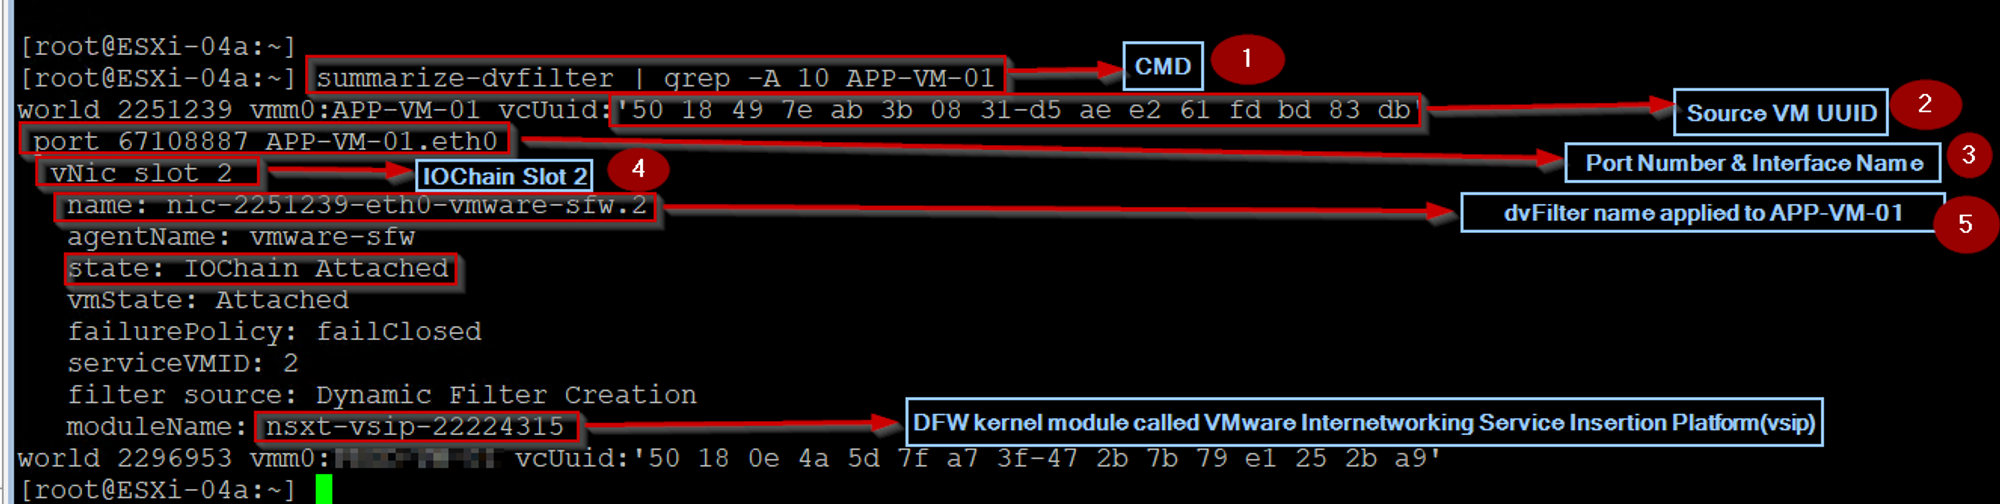
Step 1: – Use the below cmd on the host transport node to find the dvfilter name of the Source VM
[root@ESXi-04a:~] summarize-dvfilter | grep -A 10 APP-VM-01
Step 2: – We can see the UUID of the source VM.
Step 3:- – We can see the Port number and interface name of the Source VM.
Step 4: – We can see the IOChain Slot 2 (vmware-sfw) is attached the source VM vNIC level.
Step 5: – We can see the dvfilter name applied to the Source VM.
Now we got the dvfilter name to capture the packet from the Predvfilter on the Source VM.
Predvfilter on the Source VM packet capturing:
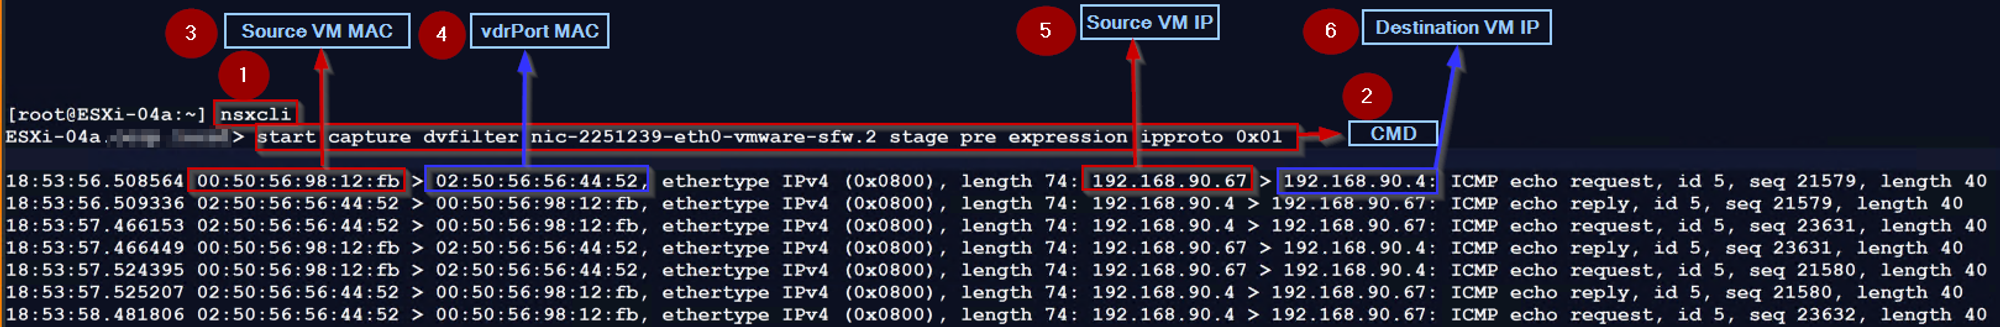
Step 1:- login with the NSXCLI
Step 2: – Use the below cmd to capture the traffic, before entering the dvfilter for firewall rules processing
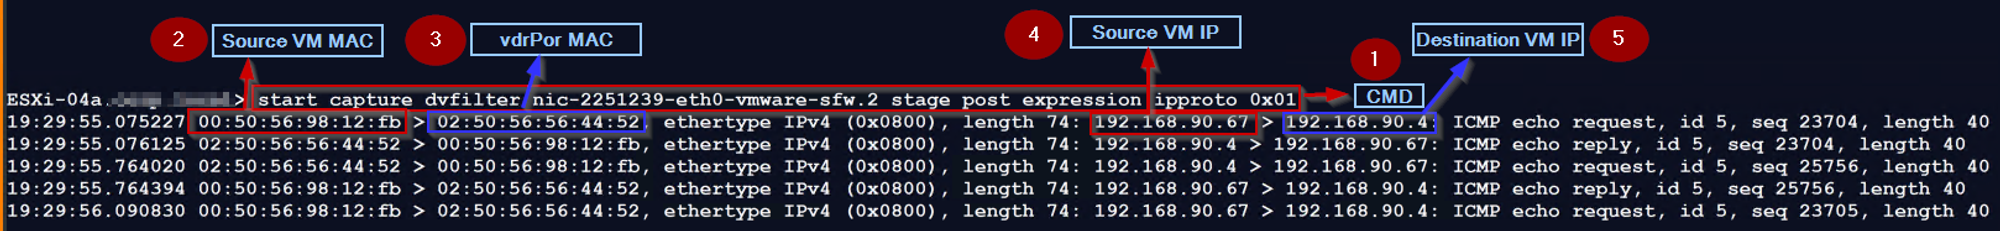
ESXi-04a.XYZ.local> start capture dvfilter nic-2251239-eth0-vmware-sfw.2 stage pre expression ipproto 0x01
Note :- Stage Pre option will capture the inbound and outbound traffic, due to this in the capture you can see the ICMP ECHO request & reply.
Step 3: -We captured the Source VM MAC—00:50:56:98:12:fb.
Step 4: – vdrPort MAC is the Destination MAC address—02:50:56:56:44:52.
Step 5: – Source VM IP — 192.168.90.67.
Step 6: – Destination VM IP —- 192.168.90.4.
3. PostdvFilter of the source VM–APP-VM-01
Capture 4: –
Use the dvfilter name(nic-2251239-eth0-vmware-sfw.2) to capture the packet from the Postdvfilter on the Source VM.
Postdvfilter on the Source VM packet capturing:
Step 1: – Use the below cmd to capture the traffic, that comes out of dvfilter after the firewall rules are processed:
ESXi-04a.XYZ.local> start capture dvfilter nic-2251239-eth0-vmware-sfw.2 stage post expression ipproto 0x01
Note: – The Stage Post option will capture the inbound and outbound traffic, due to this in the capture you can see the ICMP ECHO request & reply. In the packet capture, we can see no change as compared with the predvfilter capture packet because the dvfilter has allowed the traffic through the firewall.
Step 2: -We captured the Source VM MAC—00:50:56:98:12:fb.
Step 3: – vdrPort MAC is the Destination MAC address—02:50:56:56:44:52.
Step 4: – Source VM IP — 192.168.90.67.
Step 5: – Destination VM IP —- 192.168.90.4.
4. vdrport on the source ESXi host-ESXi-04.xyz.local

vdrPort(Virtual Distributed Router Port) on the Source Host packet capturing.
Due to T1 Distributed architecture, we should capture the packets in the Output direction(Entering the vdrPort) and Input Direction (Leaving the vdrPort).
Let’s start first capture the packet in the Output Direction
Step 1: – Use the below cmd to capture the traffic in the output direction
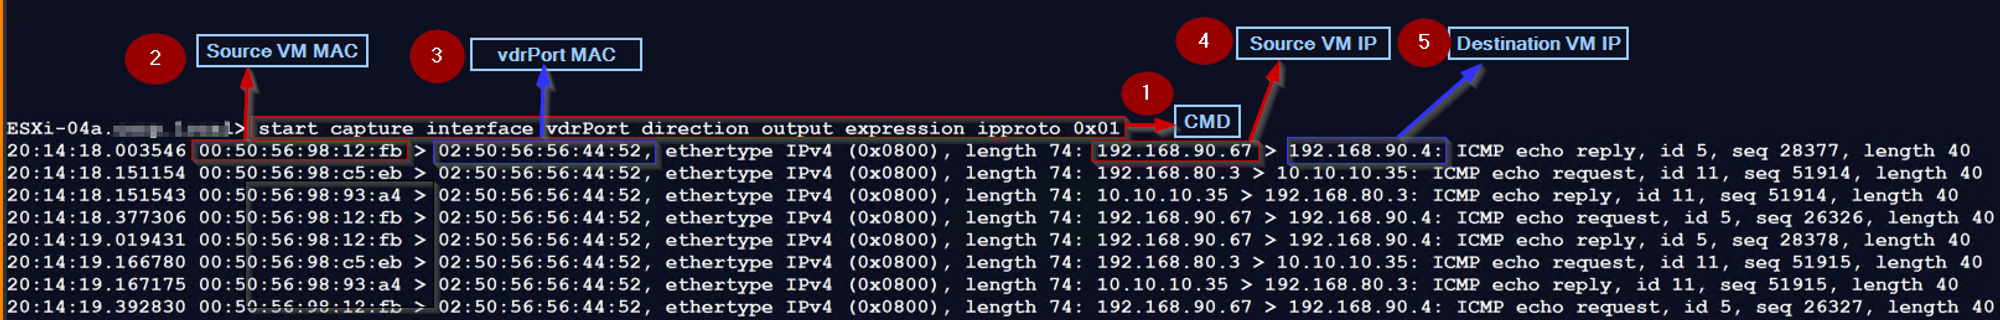
ESXi-04a.XYZ.local> start capture interface vdrPort direction output expression ipproto 0x01
Note :-The packet capture in the output direction (entering the vdrPort) shows that the packet has the source MAC of VM APP-VM-01 00:50:56:98:12:fb, and the destination MAC address is the vdrPort MAC address 02:50:56:56:44:52.
Step 2: -We captured the Source VM MAC—00:50:56:98:12:fb.
Step 3: – vdrPort MAC is the Destination MAC address—02:50:56:56:44:52.
Step 4: – Source VM IP — 192.168.90.67.
Step 5: – Destination VM IP —- 192.168.90.4.
Now We will capture the packet in the Input Direction
Step 1: – Use the below cmd to capture the traffic in the input direction
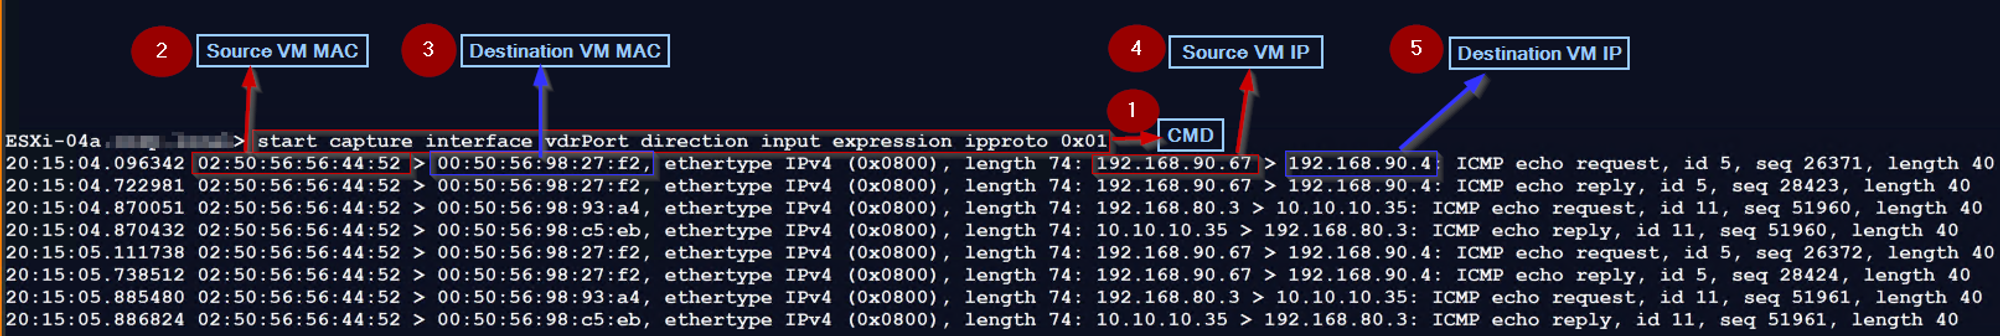
ESXi-04a.XYZ.local> start capture interface vdrPort direction input expression ipproto 0x01
Note: -The packet capture in the input direction (leaving the vdrPort) shows that the packet is forwarded by the Tier-1 DR “NSX-VPC-Operations” with the vdrPort MAC address 02:50:56:56:44:52 as the source MAC and the destination VM “WEB-VM-01” MAC address 00:50:56:98:27:f2 as the destination MAC. Here the source host then looks up the TEP, ARP, and MAC tables to identify the destination VM location and send the packet to TEP( VMK10 ) for encapsulation.
Step 2: -We captured the Source VM MAC—02:50:56:56:44:52.
Step 3: – Destination VM MAC—00:50:56:98:27:f2.
Step 4: – Source VM IP — 192.168.90.67.
Step 5: – Destination VM IP —- 192.168.90.4.
5. Source ESXi host uplink—ESXi-04—VMNIC0

Before reaching to Uplink(VMnic0) we need to find the TEP interfaces on the Source host.
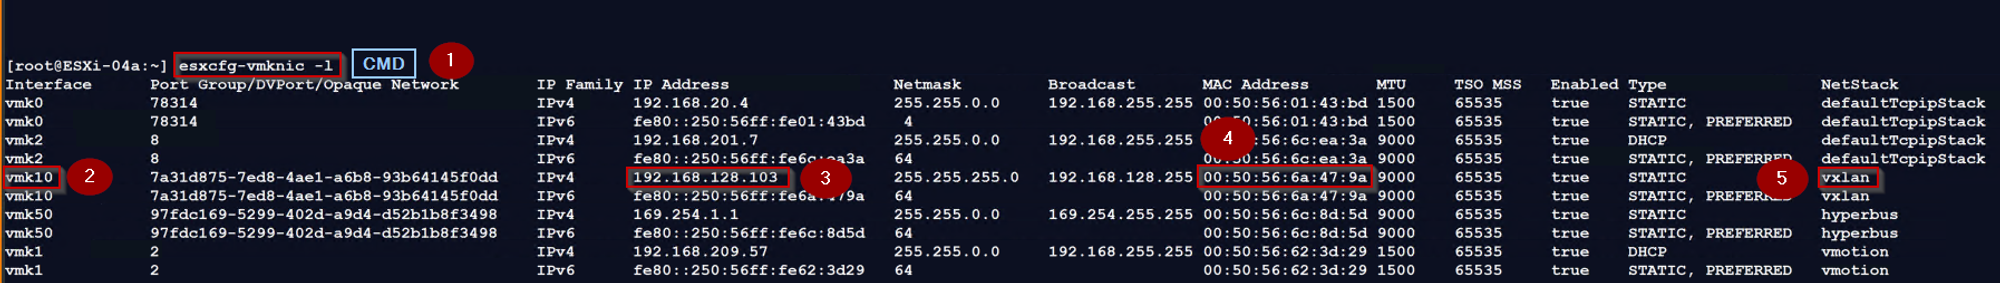
Step 1: – Use the below cmd to to find the list of VMKernel interfaces in the host.
[root@ESXi-04a:~] esxcfg-vmknic -l
Step 2: – Interface name is vmk10
Note: – VMK10 & VMK11 are used for the TEP interfaces.
Step 3: – TEP interface configured on the source ESXi host with an IP address “192.168.128.103”
Step 4: – The TEP address for vmk10 is “00:50:56:6a:47:9a”
Step 5: – The TEP interface NetStack value is “vxlan”
Now next step is to find out the DVS Name & NSX Uplinks connected to the DVS on the Source Host
Step1: – use the below cmd to to find the DVS Name on the ESXi Host
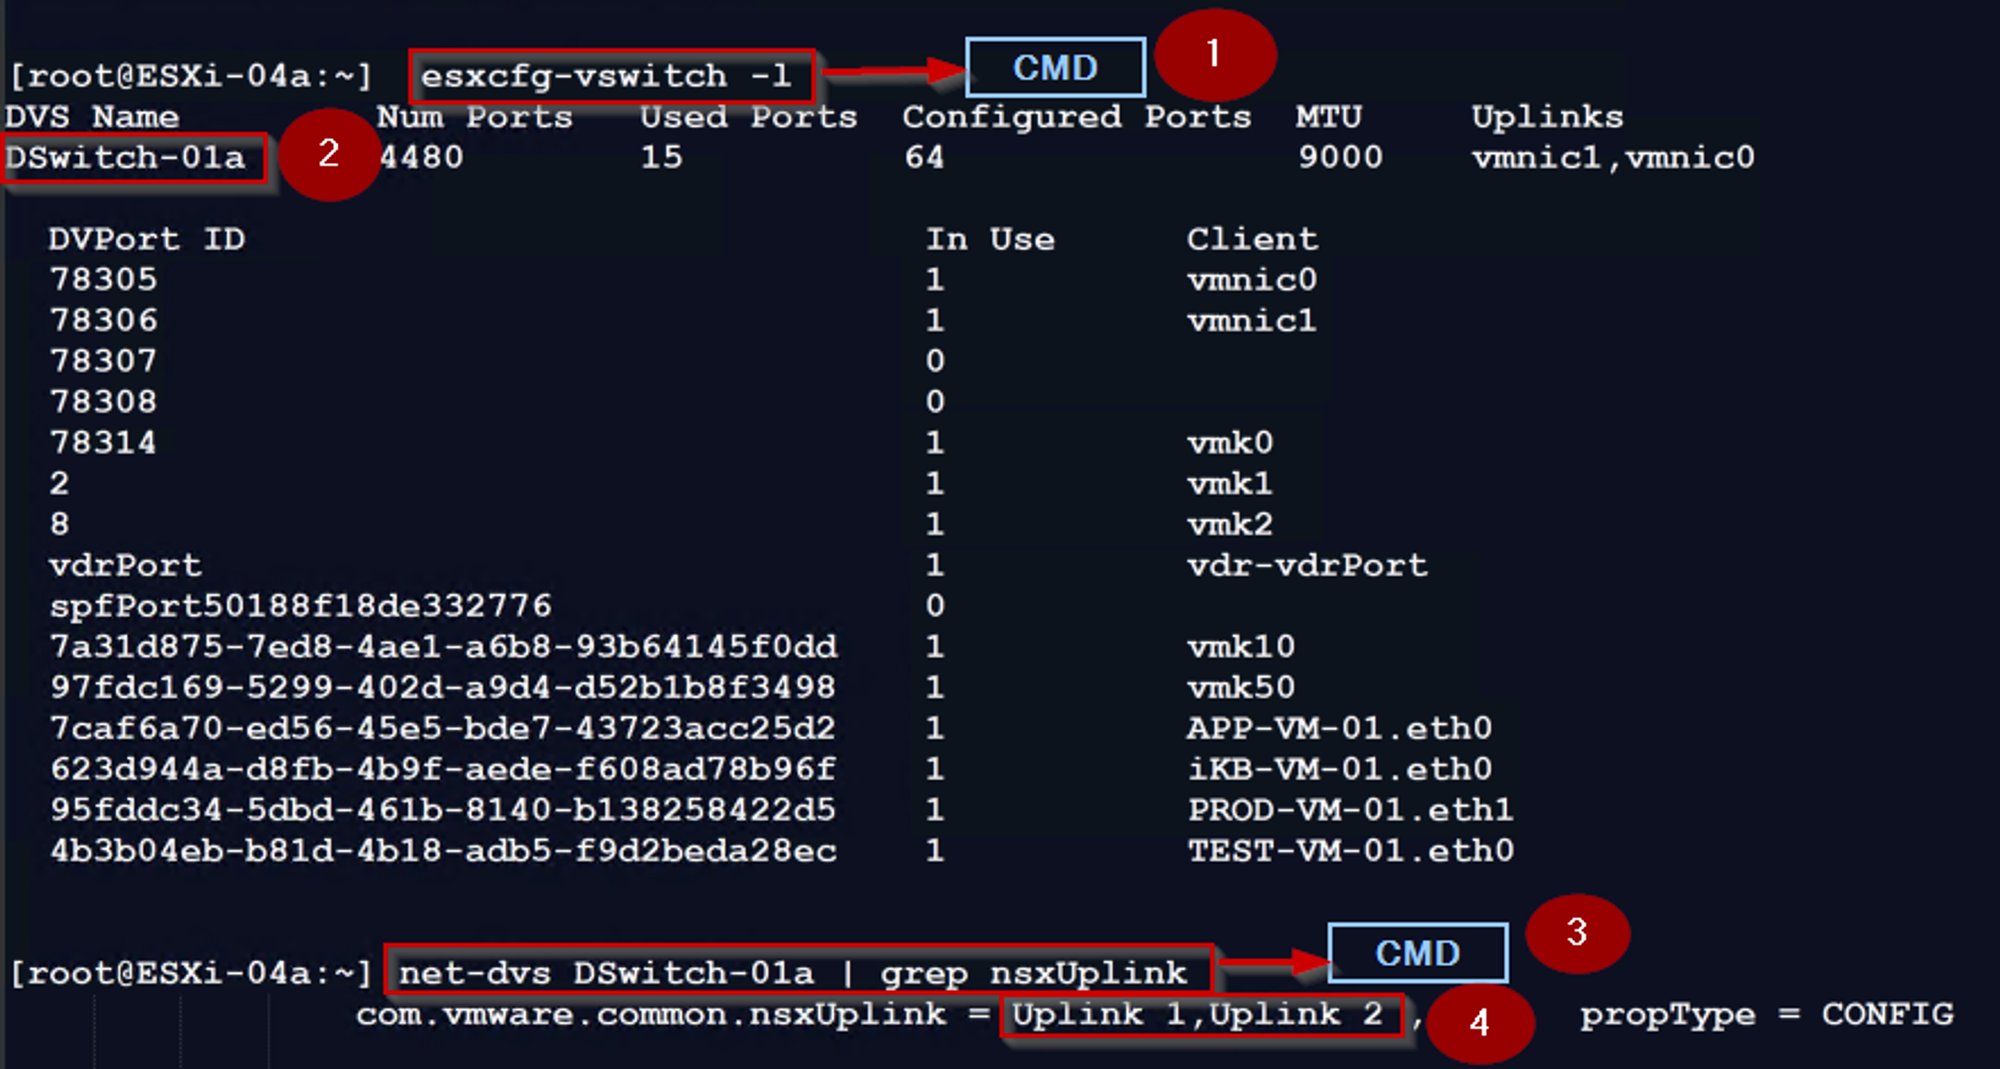
[root@ESXi-04a:~] esxcfg-vswitch -l
Step 2: – Distributed Virtual Switch Name —DSwitch-01a
Step 3:- use the below cmd to to find the DVS Uplinks used for NSX
[root@ESXi-04a:~] net-dvs DSwitch-01a | grep nsxUplink
Step 4: – DVS Uplinks Used for NSX—Uplink 1,Uplink 2
Note: – VMNIC 0 mapped with Uplink1 & VMNIC 1 mapped with Uplink2
Now next step is to find out the which Uplink is connected to TEP interface & Source VM.
Step1: – use the below cmd to identify which physical adapters are mapped to the VMs and VMkernel interfaces.
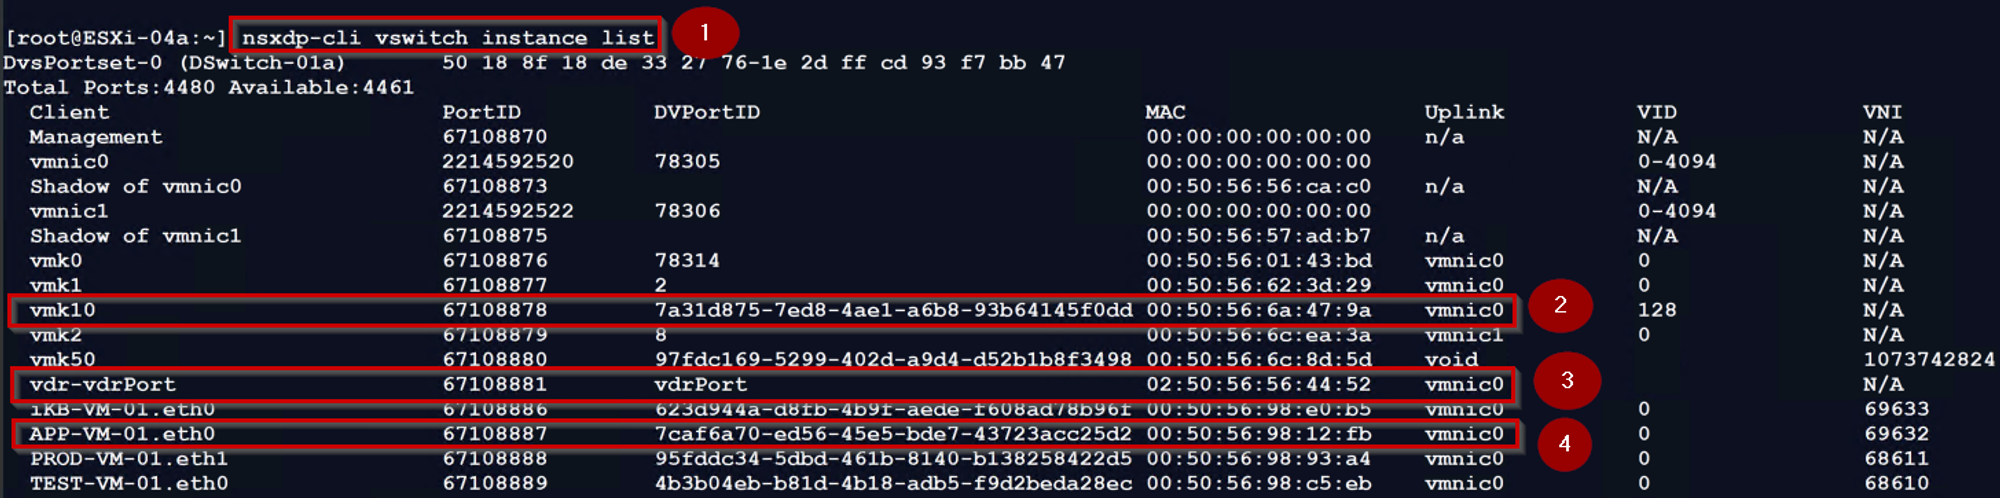
[root@ESXi-04a:~] nsxdp-cli vswitch instance list
Step 2: – TEP interface vmk10 associated uplink is vmnic0.
Step 3: – vdr-vdrPort is associated with uplink vmnic0. This is the uplink is used for sending and receiving the traffic through vmnic0.
Step 4: – Source VM(APP-VM-01.eth0) is associated with uplink vmnic0. This is the uplink is used for sending and receiving the traffic through vmnic0.
Now we have the necessary details to capture the packet of the Source Host uplink
Step1: – use the below cmd to capture the traffic leaving the uplink vmnic0 with TEP IP.
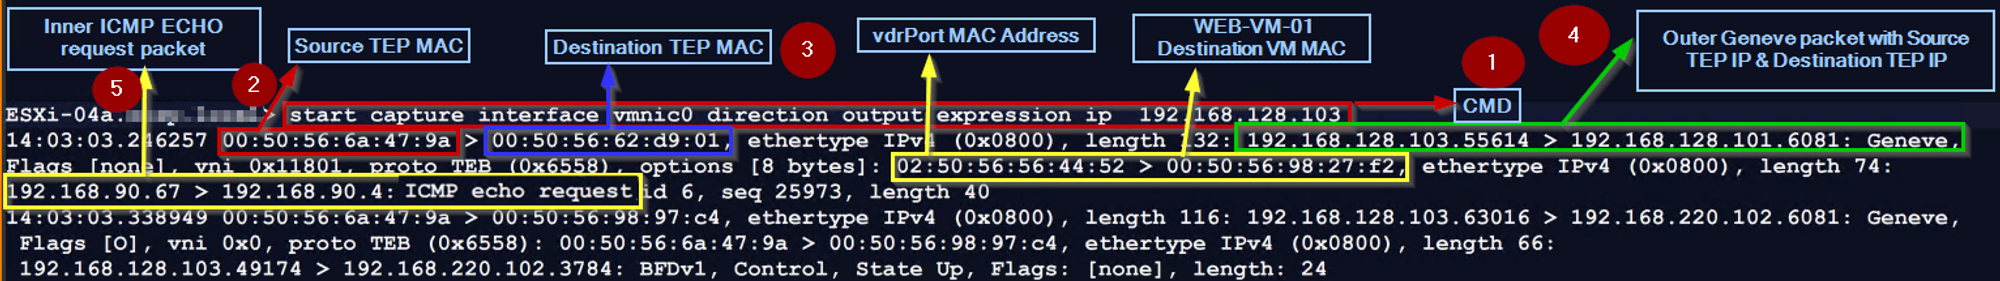
ESXi-04a.XYZ.local> start capture interface vmnic0 direction output expression ip 192.168.128.103
Note:- Direction Output on vmnic0 means we are capturing the traffic leaving the uplink with the TEP IP.
Step 2: – Source TEP MAC 00:50:56:6a:47:9a is the ESXi-04a.XYZ.local (highlight in red color).
Step 3: – Destination TEP MAC 00:50:56:62:d9:01 is the ESXi-07a.XYZ.local (highlight in blue color).
Step 4: -The packet capture has outer header encapsulated with Geneve encapsulation with source TEP IP (192.168.128.103 & destination TEP IP 192.168.128.101 (highlight in Green color).
Note:- The UDP port 6081 is the Geneve port, and VNI 0x11801 (the decimal translation is 71681) is the VNI of the segment to which the WEB-VM-01 VM is connected.
Step 5: – The packet capture has inner headers encapsulated with Geneve encapsulation source VM(APP-VM-01) IP 192.168.90.67 & destination VM(WEB-VM-01) IP 192.168.90.4 with ICMP Echo request (highlight in yellow color).
Note: -In the inner header, the source MAC is set to VDR Port MAC address(02:50:56:56:44:52), and the destination MAC is set to the WEB-VM-01 MAC address(00:50:56:98:27:f2) (highlight in yellow color).
6. Destination ESXi host uplink—ESXi07-VMNIC0

Before reaching to Uplink(VMnic0) we need to find the TEP interfaces on the Source host.
Step 1: – Use the below cmd to to find the list of VMKernel interfaces in the host.
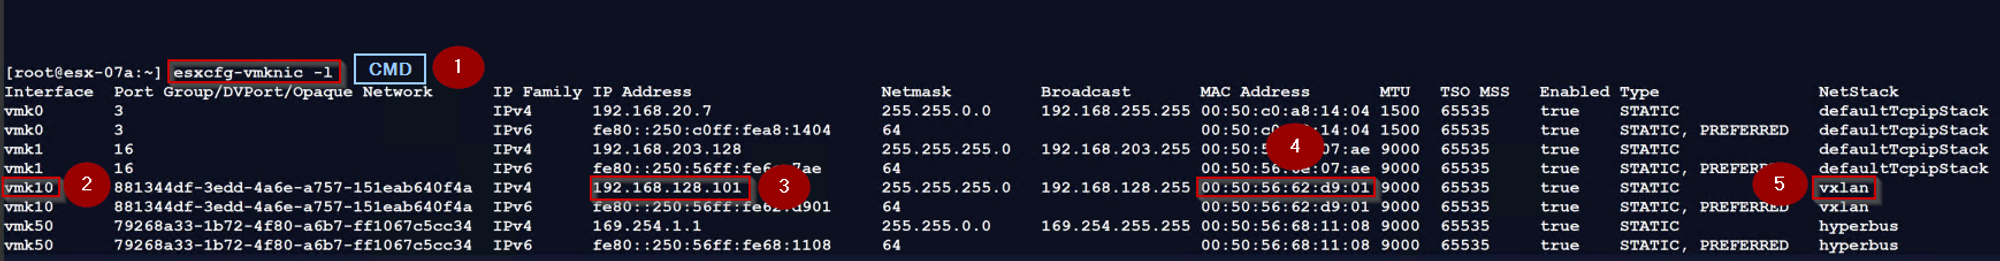
[root@esx-07a:~] esxcfg-vmknic -l
Step 2: – Interface name is vmk10
Note: – VMK10 & VMK11 are used for the TEP interfaces.
Step 3: – TEP interface configured on the destination ESXi host with an IP address “192.168.128.101”
Step 4: – The TEP address for vmk10 is “00:50:56:62:d9:01”
Step 5: – The TEP interface NetStack value is “vxlan”
Now next step is to find out the which Uplink is connected to TEP interface & Destination VM.
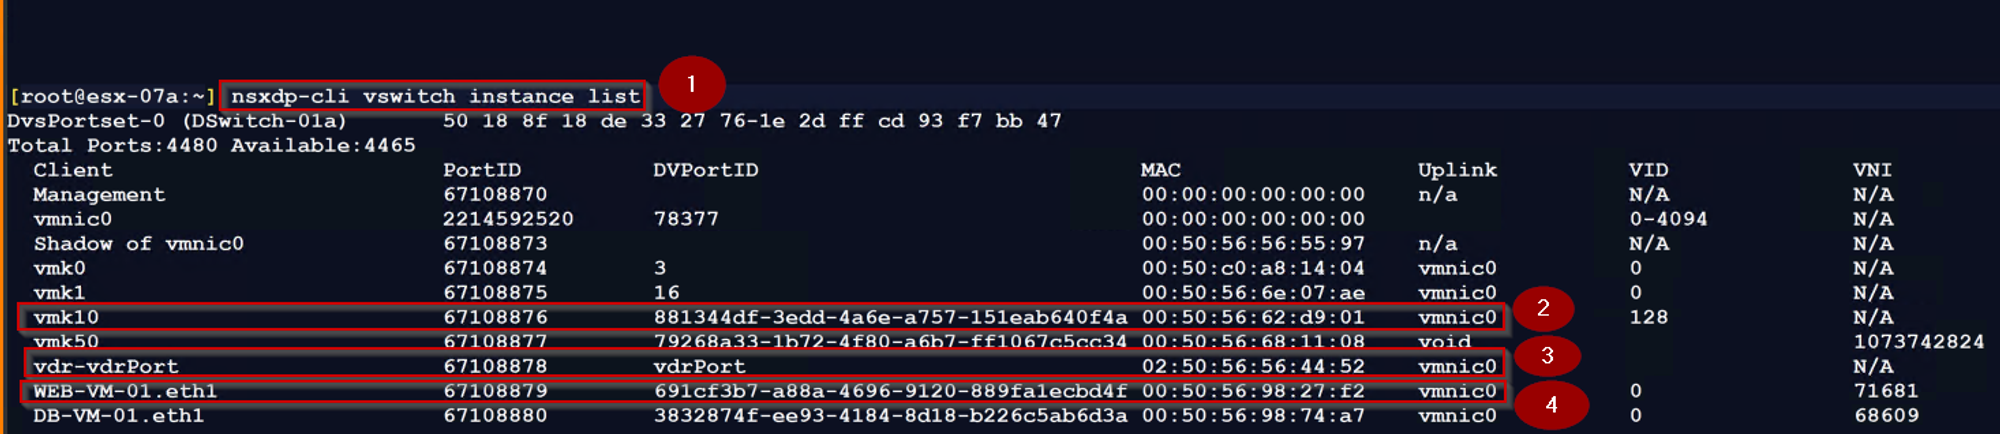
Step1: – use the below cmd to identify which physical adapters are mapped to the VMs and VMkernel interfaces.
[root@esx-07a:~] nsxdp-cli vswitch instance list
Step 2: – TEP interface vmk10 associated uplink is vmnic0.
Step 3: – vdr-vdrPort is associated with uplink vmnic0. This is the uplink is used for sending and receiving the traffic through vmnic0.
Step 4: – Destination VM(WEB-VM-01.eth1) is associated with uplink vmnic0. This is the uplink is used for sending and receiving the traffic through vmnic0.
Now we have the necessary details to capture the packet of the Destination Host uplink
Step1: – use the below cmd to capture the incoming traffic to the uplink vmnic0 with TEP IP.
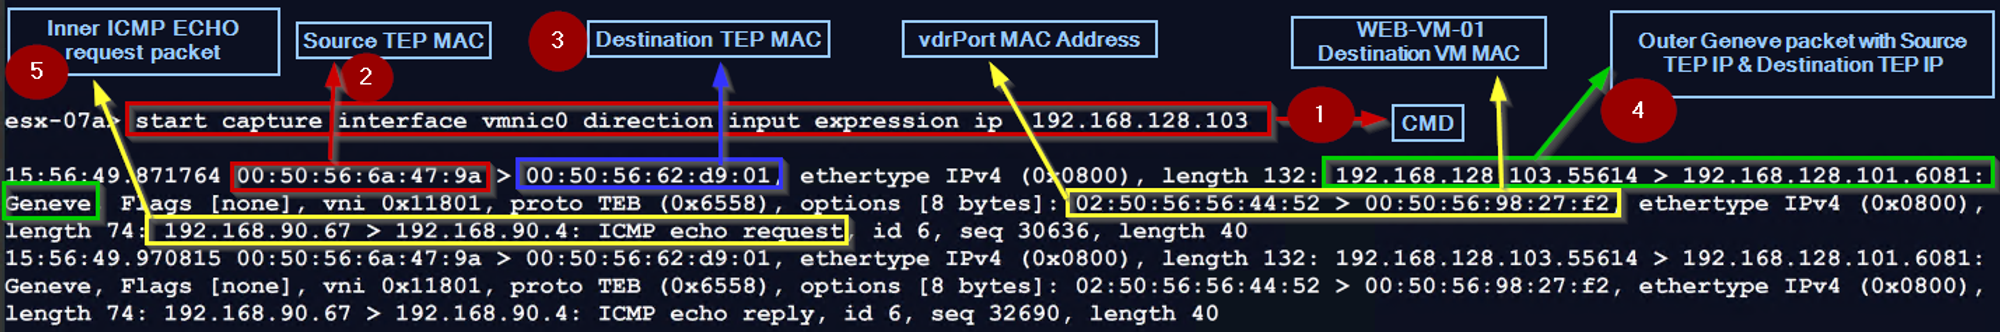
ESXi-07a.XYZ.local> start capture interface vmnic0 direction input expression ip 192.168.128.103
Note:- Direction input on vmnic0 means we are capturing the incoming traffic on the uplink with the TEP IP.
Step 2: – Source TEP MAC 00:50:56:6a:47:9a is the ESXi-04a.XYZ.local (highlight in red color).
Step 3: – Destination TEP MAC 00:50:56:62:d9:01 is the ESXi-07a.XYZ.local (highlight in blue color).
Step 4: -The packet capture has outer header encapsulated with Geneve encapsulation with source TEP IP (192.168.128.103 & destination TEP IP 192.168.128.101 (highlight in Green color).
Note:- The UDP port 6081 is the Geneve port, and VNI 0x11801 (the decimal translation is 71681) is the VNI of the segment to which the WEB-VM-01 VM is connected.
Step 5: – The packet capture has inner headers encapsulated with Geneve encapsulation source VM(APP-VM-01) IP 192.168.90.67 & destination VM(WEB-VM-01) IP 192.168.90.4 with ICMP Echo request (highlight in yellow color).
Note: -In the inner header, the source MAC is set to VDR Port MAC address(02:50:56:56:44:52), and the destination MAC is set to the WEB-VM-01 MAC address(00:50:56:98:27:f2) (highlight in yellow color).
7. PredvFilter of the destination VM—WEB-VM-01

The destination TEP receives the traffic and removes the encapsulation. Then, it sends the traffic to the segment to which the destination virtual machine is connected. Before delivering the packets to the virtual machine, the distributed firewall rules are processed. Depending on the configured rules, the packet is either allowed or dropped at the dvfilter level.
Finding the dvFilter name of the destination VM
Step 1: – Use the below cmd on the host transport node to find the dvfilter name of the Source VM
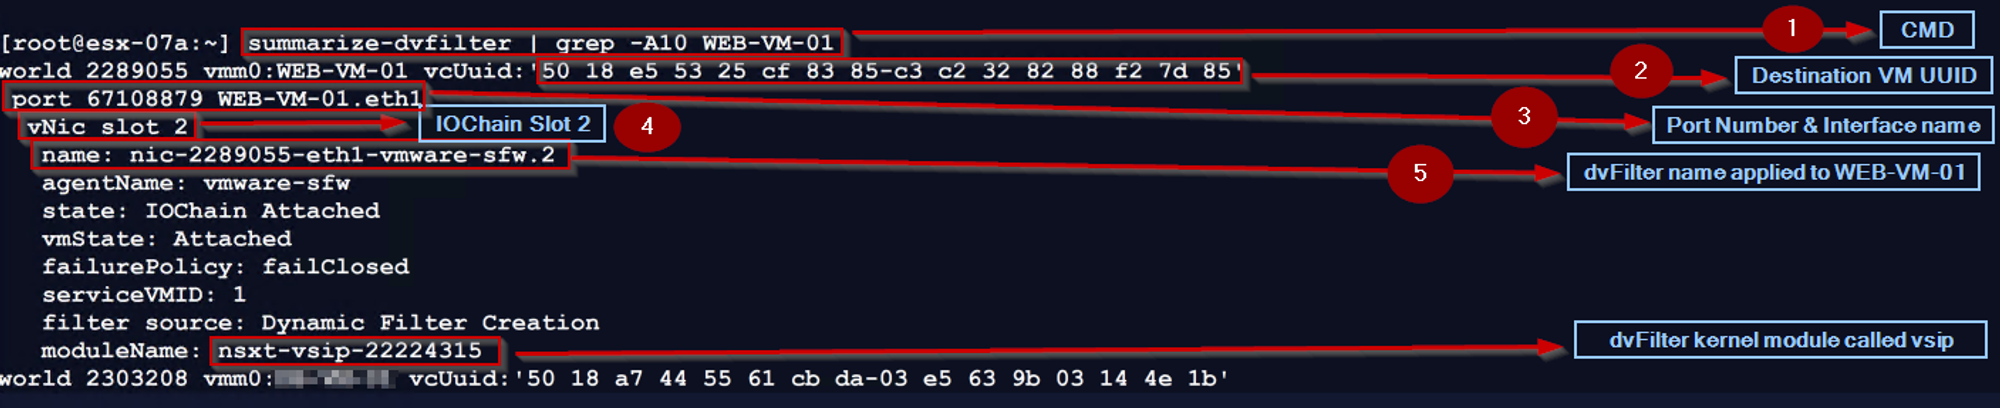
[root@esx-07a:~] summarize-dvfilter | grep -A10 WEB-VM-01
Step 2: – We can see the UUID of the destination VM.
Step 3:- – We can see the Port number and interface name of the destination VM.
Step 4: – We can see the IOChain Slot 2 (vmware-sfw) is attached the source VM vNIC level.
Step 5: – We can see the dvfilter name applied to the destination VM.
Now we got the dvfilter name to capture the packet from the Predvfilter on the Destination VM.
Predvfilter on the Destination VM packet capturing:
Step 1: – Use the below cmd to capture the traffic, before entering the dvfilter for firewall rules processing
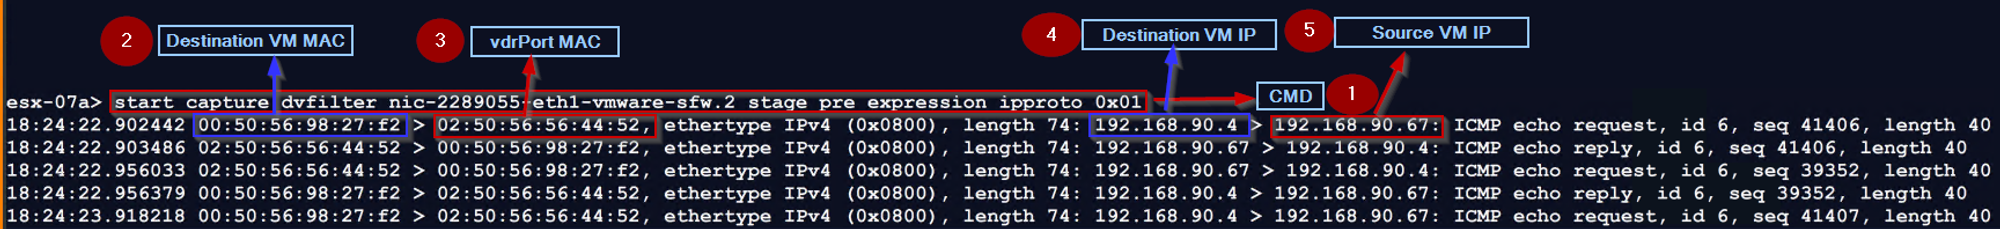
esx-07a> start capture dvfilter nic-2289055-eth1-vmware-sfw.2 stage pre expression ipproto 0x01
Note :- Stage Pre option will capture the inbound and outbound traffic, due to this in the capture you can see the ICMP ECHO request & reply.
Step 2: -We captured the destination VM MAC—00:50:56:98:27:f2.
Step 3: – vdrPort MAC is the Source MAC address—02:50:56:56:44:52.
Step 4: – Destination VM IP —- 192.168.90.4
Step 5: – Source VM IP — 192.168.90.67.
Additional Info:- let we see the packet flow on the vsip level.
Step 1: – Use the below cmd to capture the traffic, entering the vsip kernel module.
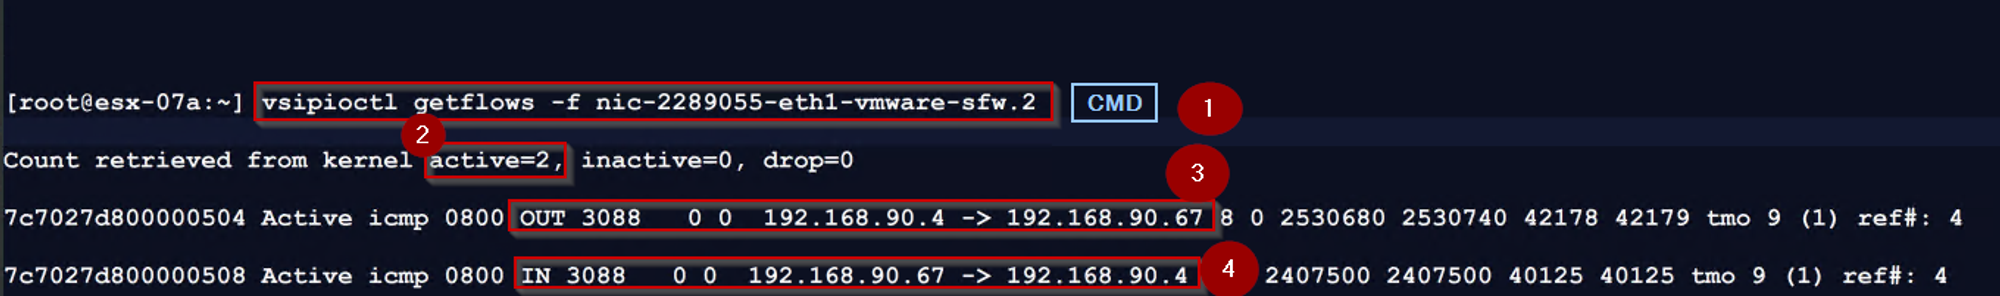
[root@esx-07a:~] vsipioctl getflows -f nic-2289055-eth1-vmware-sfw.2
Step 2: – There are 2 no’s of Active connections.
Step 3: – Output direction traffic from destination VM WEB-VM-01 to Source VM APP-VM-01 actively ICMP.
Step 4: – Input direction traffic from Source VM APP-VM-01 to destination VM WEB-VM-01 actively ICMP.
8. PostdvFilter of the destination VM—WEB-VM-01

Use the dvfilter name(nic-2289055-eth1-vmware-sfw.2) to capture the packet from the Postdvfilter on the destination VM.
Postdvfilter on the Source VM packet capturing:
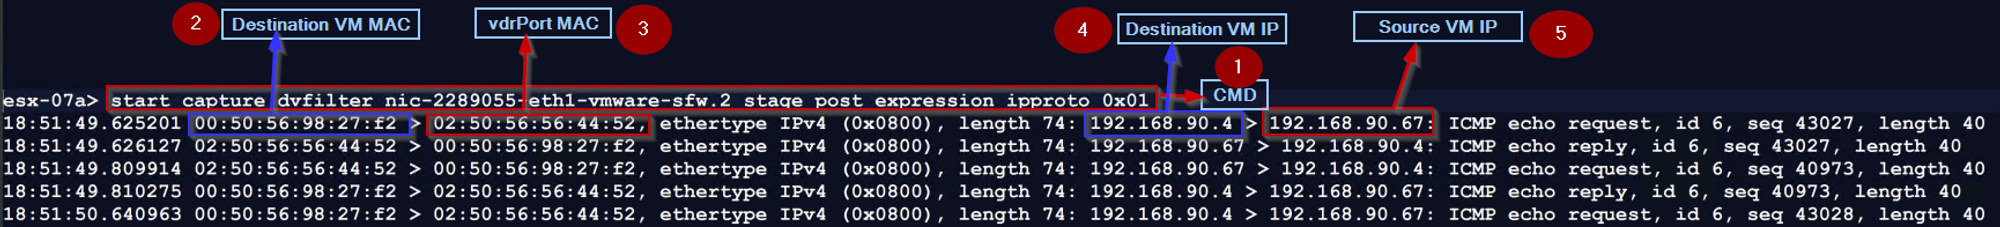
Step 1: – Use the below cmd to capture the traffic, that comes out of dvfilter after the firewall rules are processed:
esx-07a> start capture dvfilter nic-2289055-eth1-vmware-sfw.2 stage post expression ipproto 0x01
Note: – The Stage Post option will capture the inbound and outbound traffic, due to this in the capture you can see the ICMP ECHO request & reply. In the packet capture, we can see no change as compared with the predvfilter capture packet because dvfilter has allowed the traffic through the firewall.
Step 2: -We captured the Destination VM MAC—00:50:56:98:27:f2.
Step 3: – vdrPort MAC is the Source MAC address—02:50:56:56:44:52.
Step 4: -Destination VM IP —- 192.168.90.4.
Step 5: – Source VM IP — 192.168.90.67.
9. vNIC of the destination VM—WEB-VM-01
Destination VM vNIC level packet capturing: –
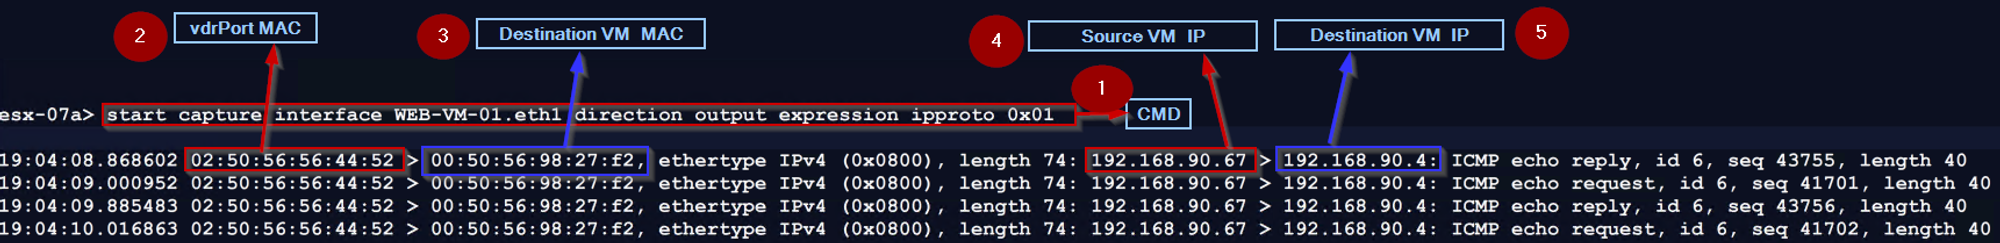
Step 1 use the below cmd to capture the vNIC traffic of the destination VM.
start capture interface WEB-VM-01.eth0 direction input expression ipproto 0x01
this cmd means we are capturing an entering switch port traffic of the destination VM vNIC.
Step 2: -vdrPort MAC is the Source MAC address—02:50:56:56:44:52.
Step 3: – We captured the Destination VM MAC—00:50:56:98:27:f2.
Step 4: – Source VM IP — 192.168.90.67.
Step 5: – Destination VM IP —- 192.168.90.4.
Finally, the packet is successfully delivered from Source VM APP-VM-01 to Destination VM WEB-VM-01.
Conclusion
We extend our gratitude for your attentiveness to this article. Our goal was to delineate the parameters of VPC administration and elucidate how traceflow can assist VPC administrators in comprehending packet flow through the GUI. Additionally, we explored how to capture packets at nine distinct locations along the path from source to destination and detailed the utilization of the vsip kernel to obtain insight into the dvfilters. We trust that this article has proven informative and worthwhile.

Leave a comment