
- Introduction
- Feature Progression: VCF 9.0 vs. VCF 9.1
- Architectural Typologies: The Three Log Management Models
- Operational Verification Sequence Blueprint
- Conclusion
- Technical Reference & Next Steps
Introduction
Managing enterprise infrastructure logs within VMware Cloud Foundation (VCF) historically incurred a notable compute and administrative overhead. Deploying, upgrading, and maintaining an external multi-VM cluster of Aria Operations for Logs (formerly Log Insight) required dedicated lifecycle management, isolated administrative credentials, and manual syslog-forwarding configurations. This architecture also carried a circular boot dependency risk if the logging cluster resided on the primary storage array it was tasked with auditing during a cold-start failure.
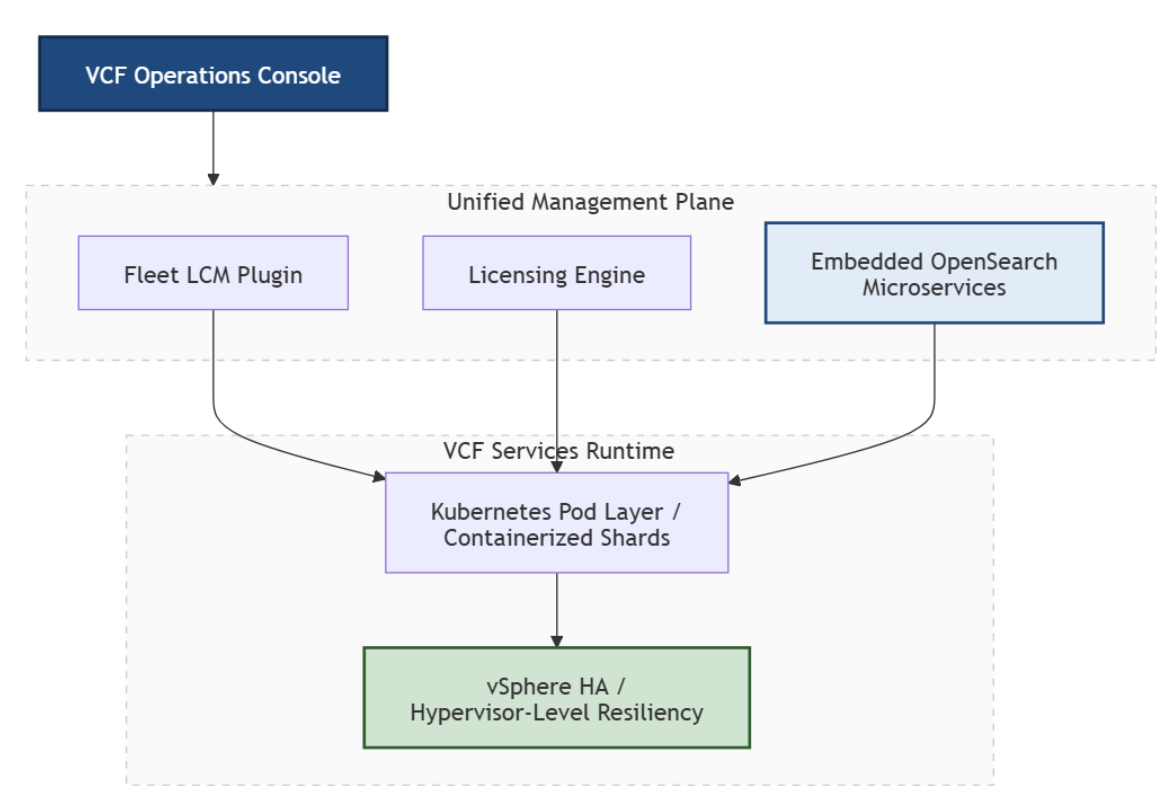
VMware Cloud Foundation (VCF) 9.1 removes this external appliance requirement. By deprecating the legacy standalone logging virtual machines, VCF 9.1 introduces an embedded OpenSearch core logging engine running directly within the consolidated VCF Management Services architecture. This design shifts log ingestion, index parsing, and alerting from a decoupled toolset into a core platform microservice.
Feature Progression: VCF 9.0 vs. VCF 9.1
The consolidation of the logging framework progressed through two specific architectural milestones across the major version releases:
| Architectural Metric | VMware Cloud Foundation 9.0 | VMware Cloud Foundation 9.1 |
| Backend Engine State | Legacy Aria Operations for Logs code engine executing on standalone virtual appliance frameworks. | Rewritten as native OpenSearch containerized microservices running inside a Kubernetes runtime. |
| Control Plane UI | Integrated Log Analytics view inside the central VCF Operations UI; underlying infrastructure remained separated. | Complete structural convergence. All management, rule sets, public APIs, and log configurations share a single console. |
| Network Footprint | Utilized standard static IP assignments for external appliance nodes and virtual load balancers. | Demands a dedicated, isolated /27 CIDR subnet block on the management network to route the internal runtime cluster pods. |
| Lifecycle Workflow | Managed as a secondary component patch cycle via Aria Suite Lifecycle Manager. | Handled automatically as a unified core platform element via Fleet Lifecycle Management. |
Architectural Typologies: The Three Log Management Models
VCF 9.1 classifies log infrastructures into three distinct architectural configurations based on scale-out boundaries and geography:
| Deployment Model | Target Architecture | Resiliency Driver | Scale Boundary | Functional Blueprint |
| Simple Log Management Model | Single-site Management Domains / Consolidated single-cluster footprints. | vSphere HA (Hypervisor-Level Automated Restarts) | Strictly bounded to a single vSphere Cluster layout within the primary Management Domain. | Eliminates application-layer clustering and external load balancers. Offloads database engine uptime to native ESXi host recovery cycles. |
| High Availability (HA) Log Management Model | High-throughput enterprise production workloads across dense environments. | Multi-node Application Clustering + External Load Balancer VIPs | Scales horizontally across multi-rack cluster topologies within a local site boundary. | Implements active distributed processing across concurrent runtime shards. Requires external load balancers for persistent stream routing. |
| Multi-Instance Log Management Model | Geographically isolated multi-region VCF architectures. | Cross-Forwarding Replication Pipelines + Centralized Analytics Clusters | Spans multiple physical regions and distinct SDDC infrastructure boundaries globally. | Provisions robust edge-to-core syslog forwarding topologies, consolidating telemetry data streams into a single query plane. |
Deep-Dive: Design Boundaries of the Simple Model
The Simple Log Management Model focuses strictly on resource reclamation within the primary management cluster. By executing the logging layer as integrated microservices, availability tasks are handled natively by the hypervisor. If a physical host hosting the logging container experiences a hardware fault, vSphere HA restarts the service container on a surviving host node.
However, architects must account for two rigid boundary conditions when implementing this configuration model:
| Boundary Class | Constraint Parameter | Operational Enforcement | Technical Impact |
| Multi-Cluster Limit | Single vSphere cluster topology. | Validated exclusively inside the primary Management Domain cluster. | Scaling across multi-rack expansions or multiple management clusters requires a configuration shift to the High Availability Model. |
| Ingestion Targeting | Explicit target domain mapping. | Initialization wizard requires explicit binding to domain boundaries. | Configuration parameters cannot be left unassigned or initialized empty during Day-2 deployment. |
Production Implementation Constraints & Infrastructure Dependencies
Transitioning to this converged architecture introduces definitive constraints that infrastructure teams must evaluate during pre-flight validation:
| Deployment Guardrail | Technical Mechanism / Risk | Operational Enforcement & Mitigation |
| Syslog Security Enforcement (Port 1514) | VCF 9.1 platform hardening drops unencrypted cleartext logs. Default syslog traffic traversing Port 514 is blocked for vCenter components. | Mandatory migration of all ESXi hosts and management-plane assets to TLS-encrypted Port 1514 before initialization to avoid an ingestion blackout.Click Here |
| DNS Case Sensitivity & Hygiene | The fleet-lcm orchestration plugin enforces strict lower-case string-matching validation for management TLS certificate handshakes. | Mixed-case or upper-case character records in DNS forward or reverse lookup zones break automation checks, causing an HTTP 500 internal initialization fault. Click Here |
| Resource Overhead Reclamation | Shifting database engine resiliency from the application layer to the hypervisor (vSphere HA) eliminates the need for dedicated, idle cluster hosts. | Decommissioning the three legacy standalone Aria Logging virtual machines reclaims a baseline footprint of 12 vCPUs and 48 GB of RAM for production compute availability. Click Here |
Deployment Sizing & Resource Allocation Framework
When executing the Add Component > Log Management workflow, the compute profile assigned to the OpenSearch processing engine must align with the environment’s total log-per-second (LPS) volume. Misallocating these values can lead to indexing dropouts or source thread starvation.
| Deployment Profile Size | vCPU Allocation | Memory (RAM) Allocation | Target Operational Footprint |
| Small | 4 vCPU | 16 GB | Evaluation sandboxes, remote lab environments, and small branch offices. |
| Medium | 8 vCPU | 32 GB | Core enterprise production sites with predictable syslog volume profiles. |
| Large | 16 vCPU | 64 GB | High-density multi-cluster infrastructures requiring aggressive security indexing. |
Note: – Resource allocation profiles directly impact storage lifecycle properties, log retention periods, and index shard allocations. To map specific data constraints to your hardware specifications, cross-reference your bill of materials against the official Configuration Maximums .
Operational Verification Sequence Blueprint
Phase 1: Validating Day-2 Core Component Lifecycles
Capture 1: –
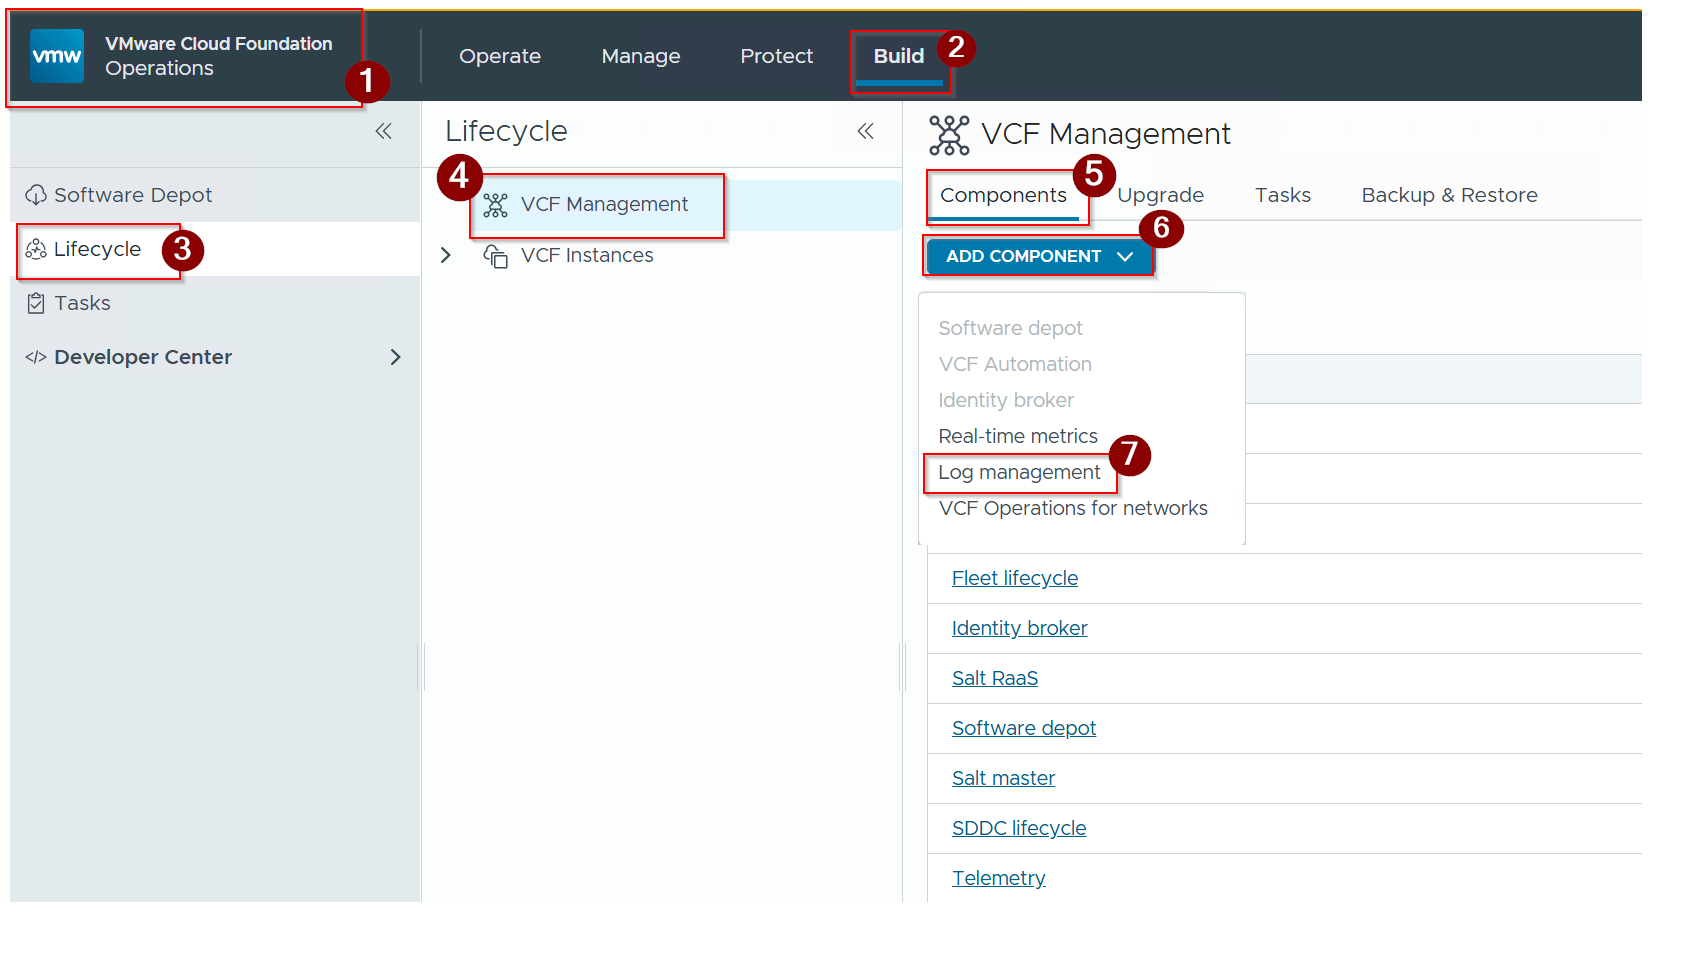
- Connect to the primary VCF Operations Console environment using administrative credentials.
- Click on build.
- Click on Lifecycle.
- Click on VCF management.
- Click on Components.
- Click on ADD Component
∨dropdown button. - Click on Log management.
Capture 2: –
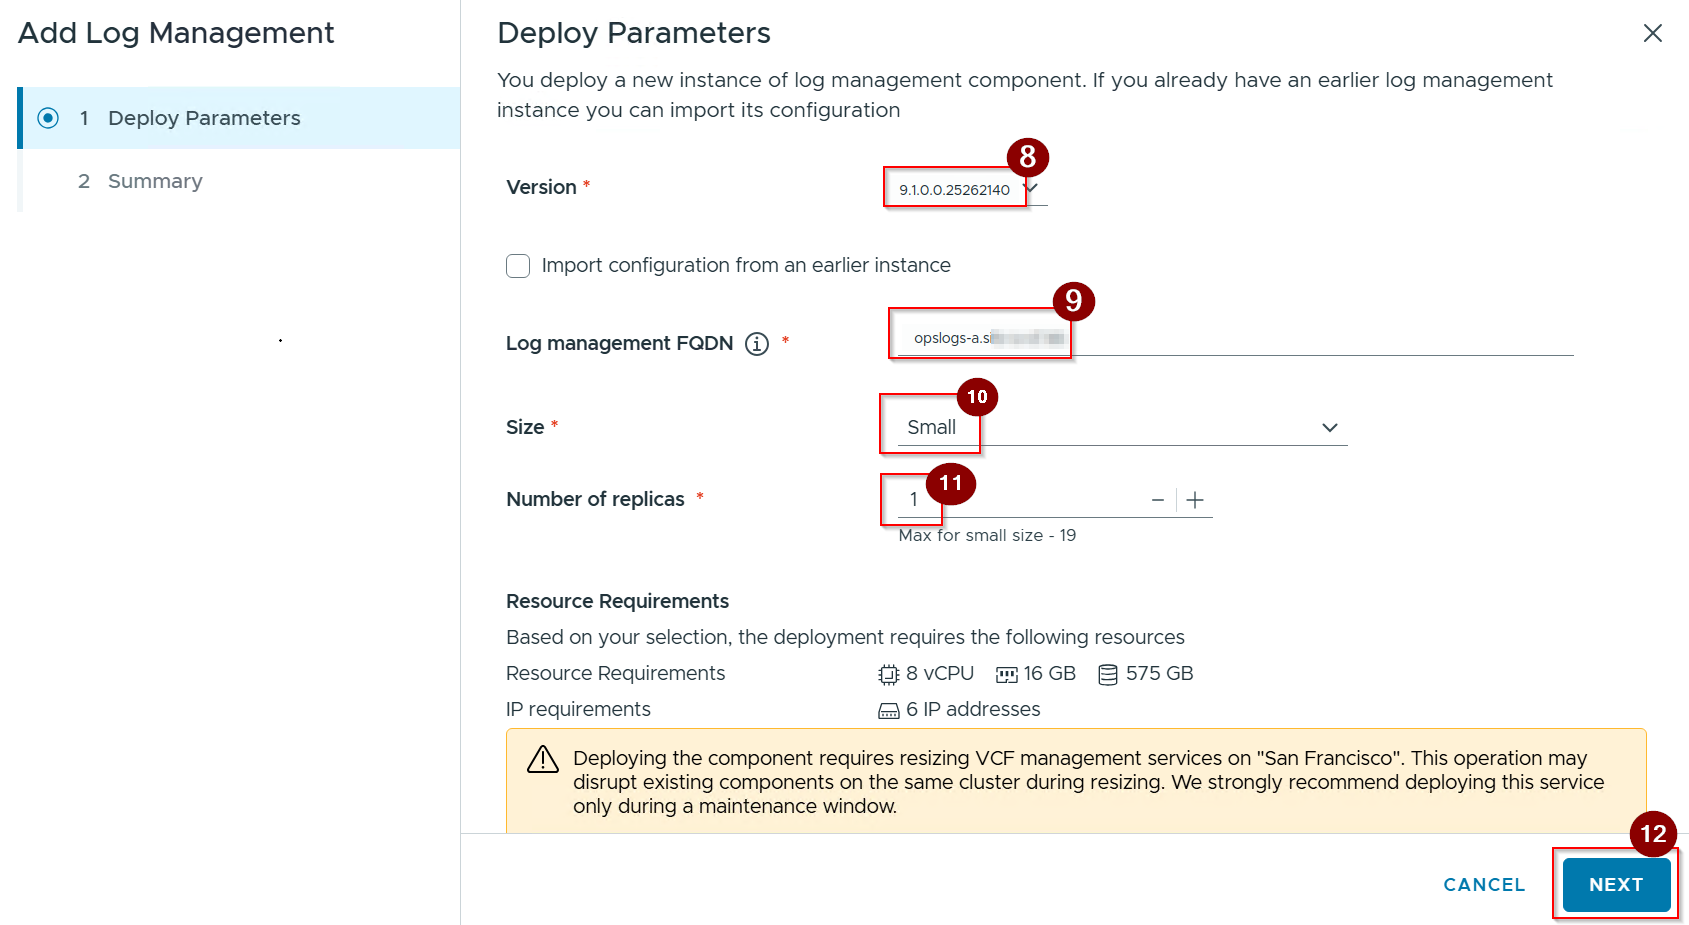
8. Select the Version.
9. Give the log management FQDN.
10. Give the size.
11. Give the number of replicas.
12. Click on Next and click of next under summary.
Capture 3: –
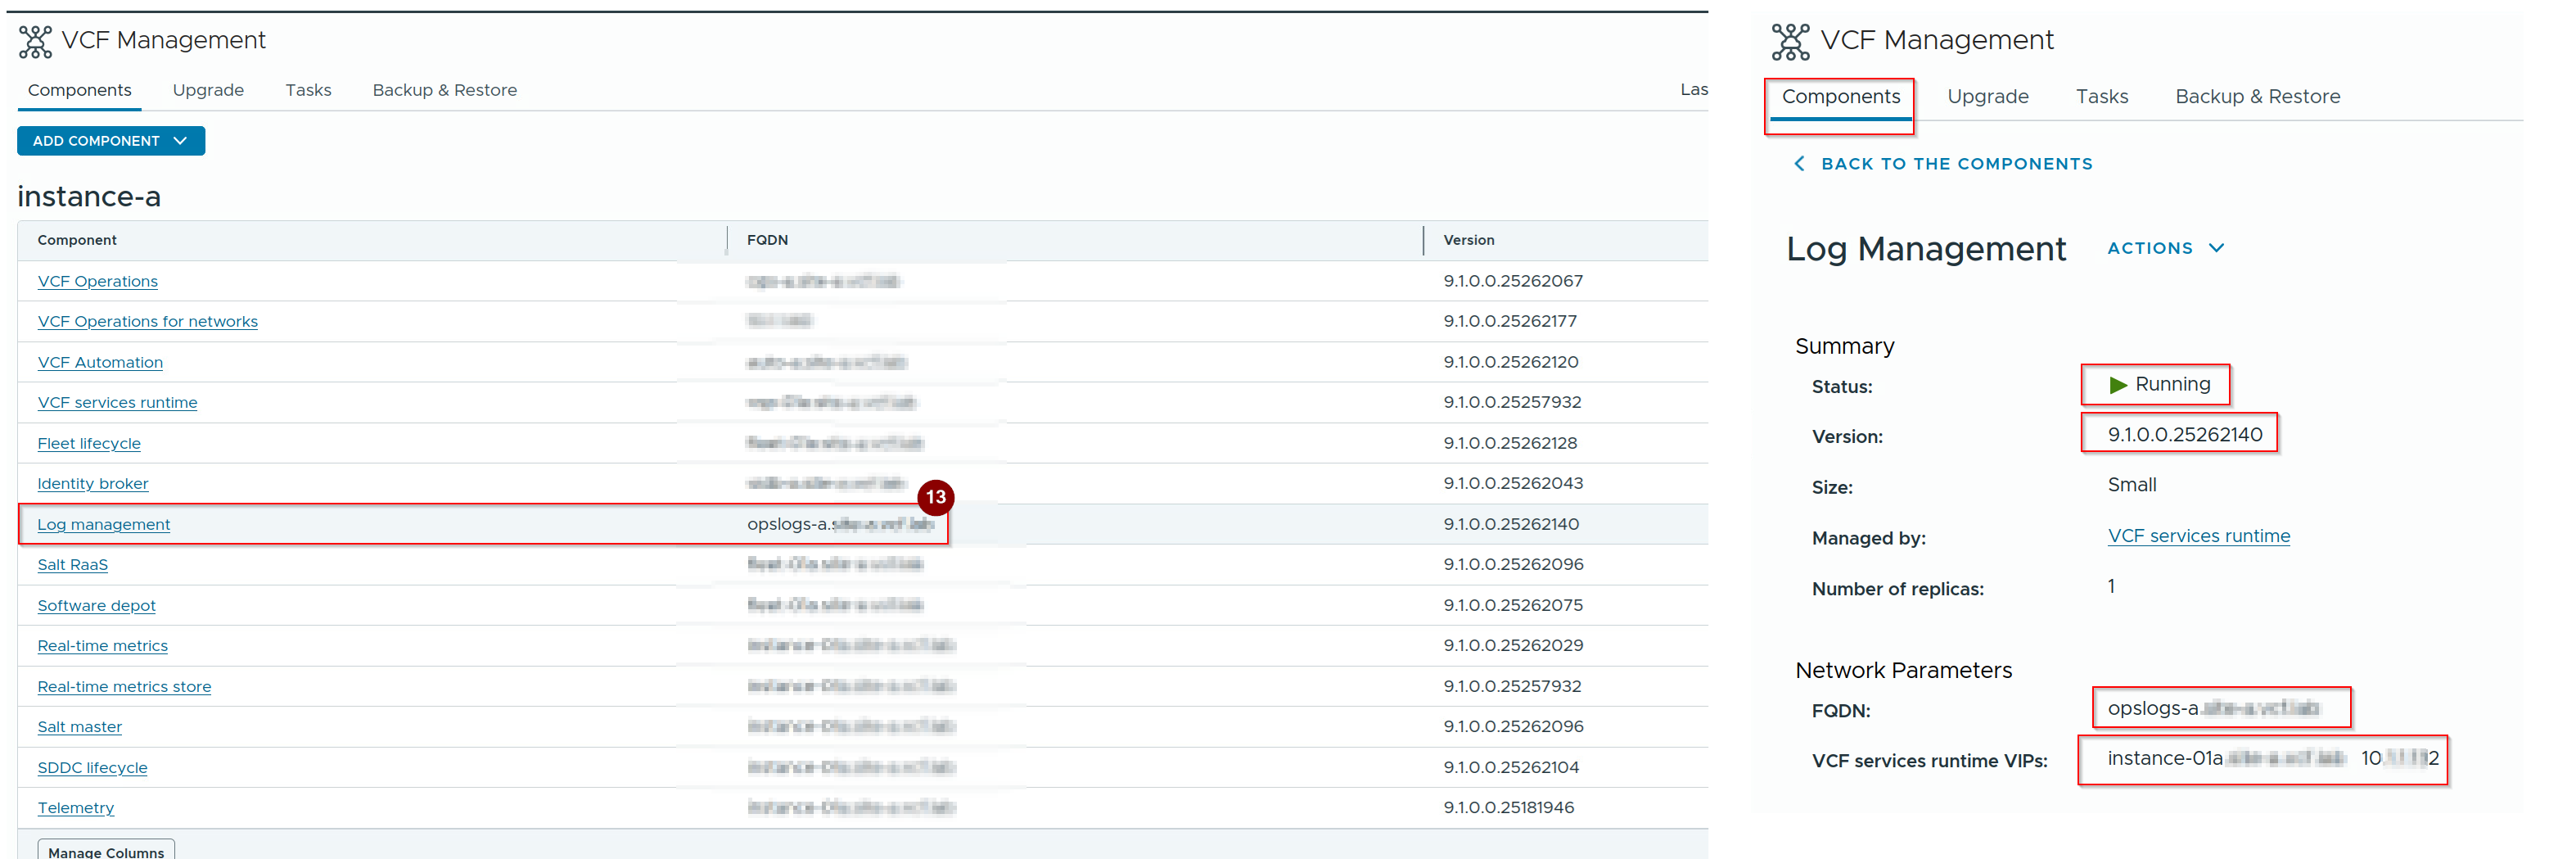
13. Log management is configured.
Phase 2: Verifying Domain-Level Ingestion Hooks
Capture 1: –
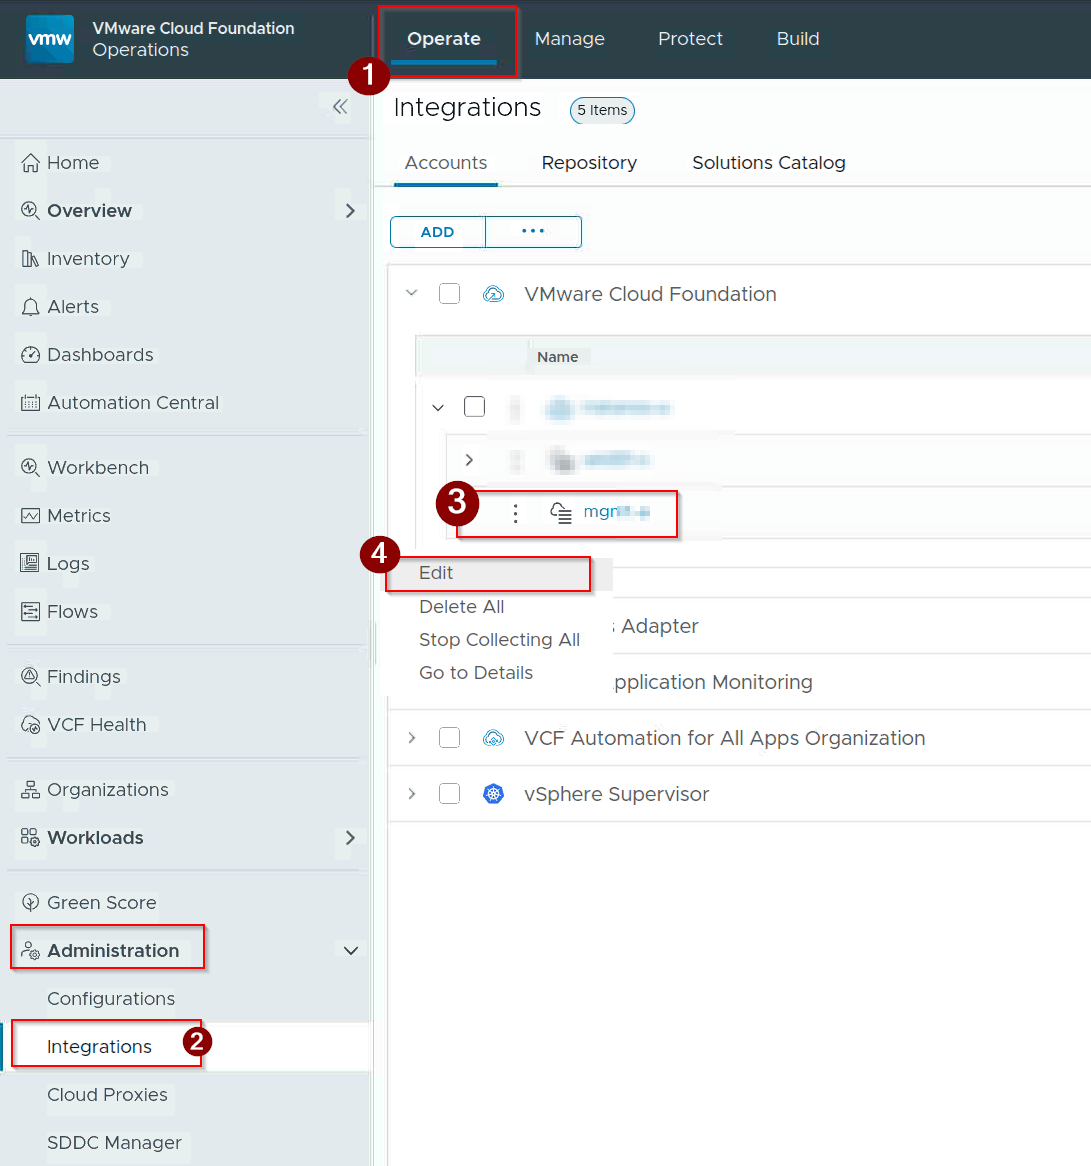
- Click on Operate.
- Navigate to integrations under administration.
- Select the primary VCF Management Domain target profile (
MGMT). - Click on Edit.
Capture 2: –
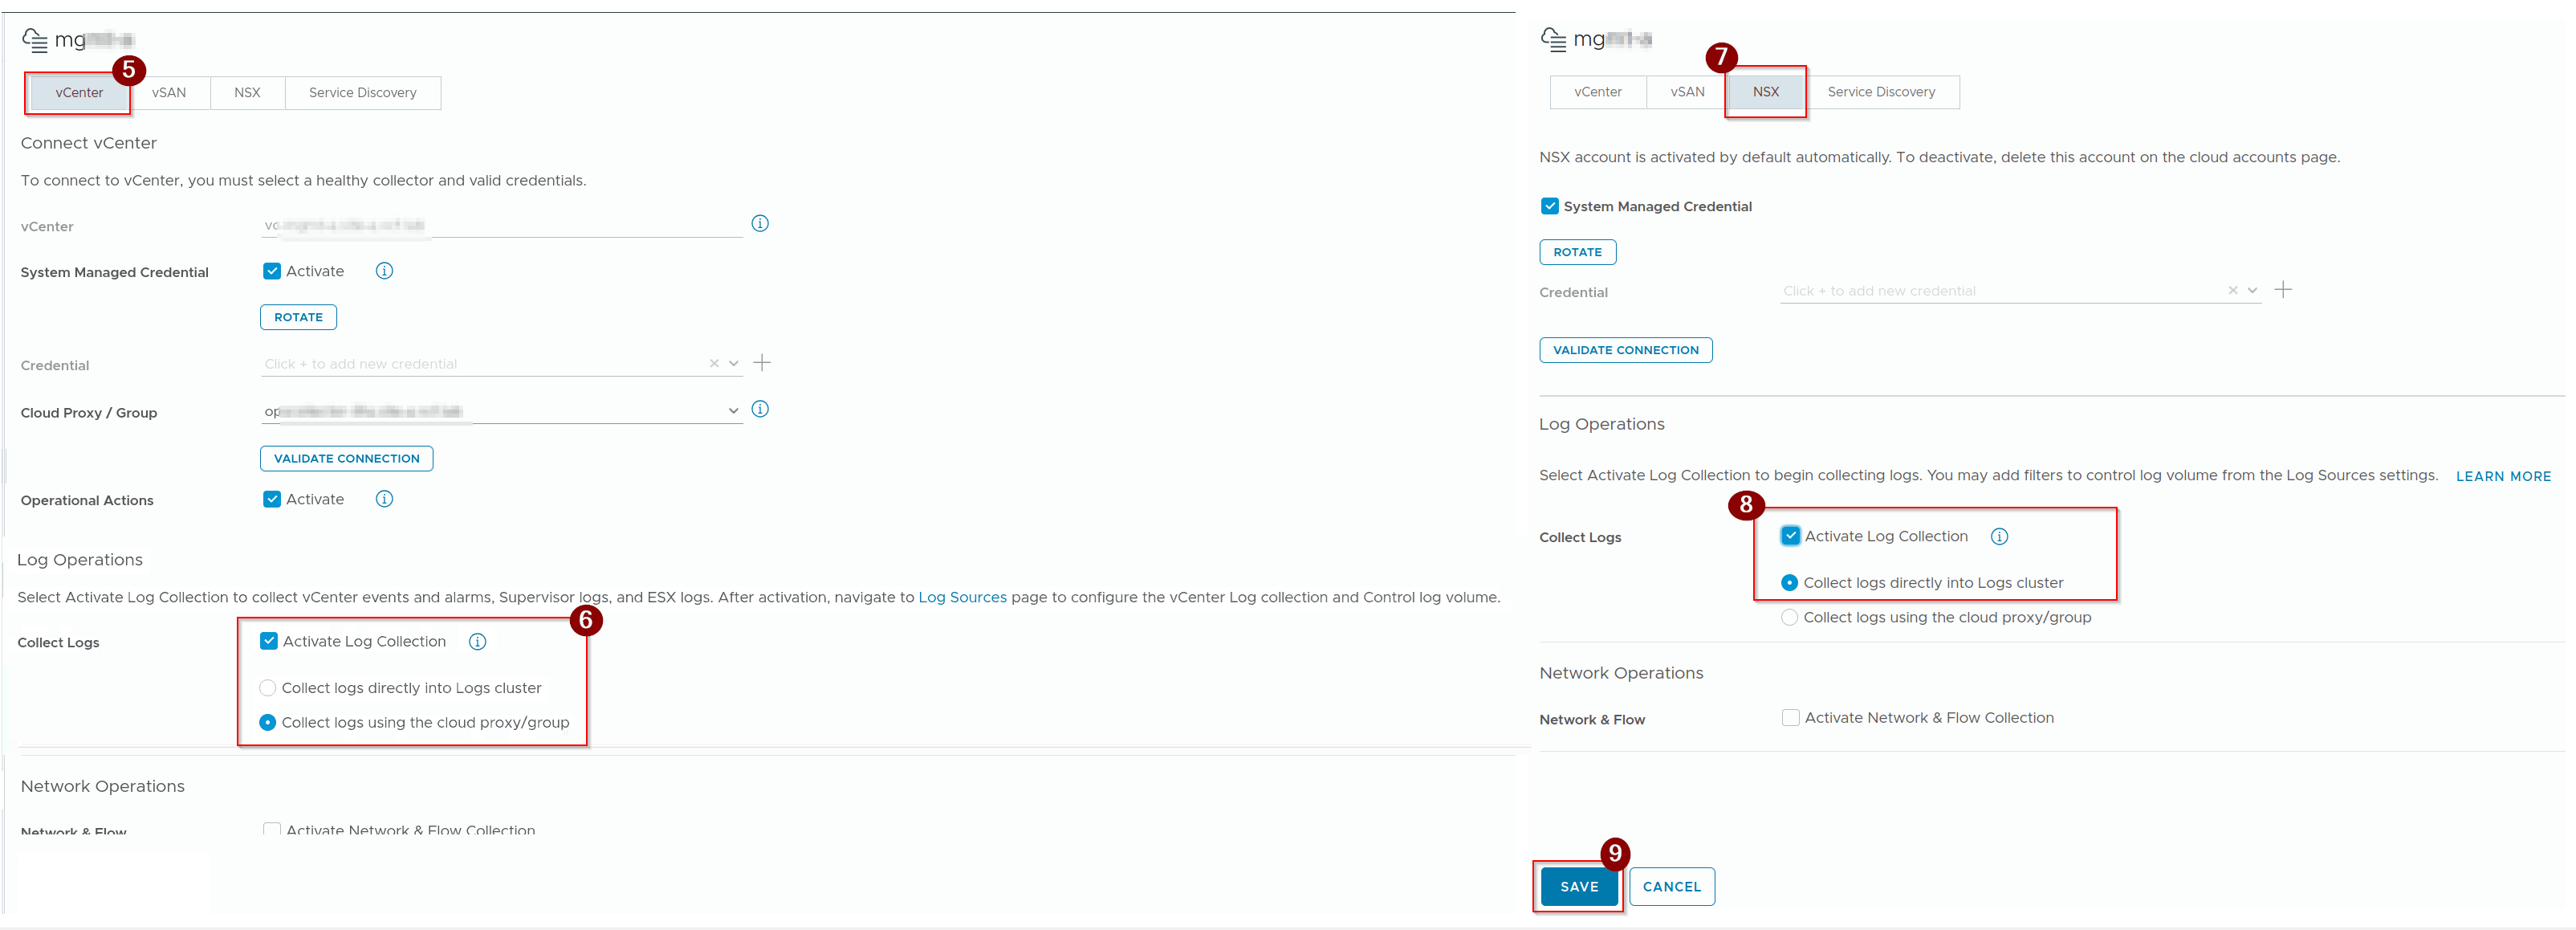
5. Click on vCenter.
6. Select the Check box of Activate log Collection.
7. Select the NSX.
8. Select the Check box of Activate log Collection.
9. Click on Save.
Capture 3: –
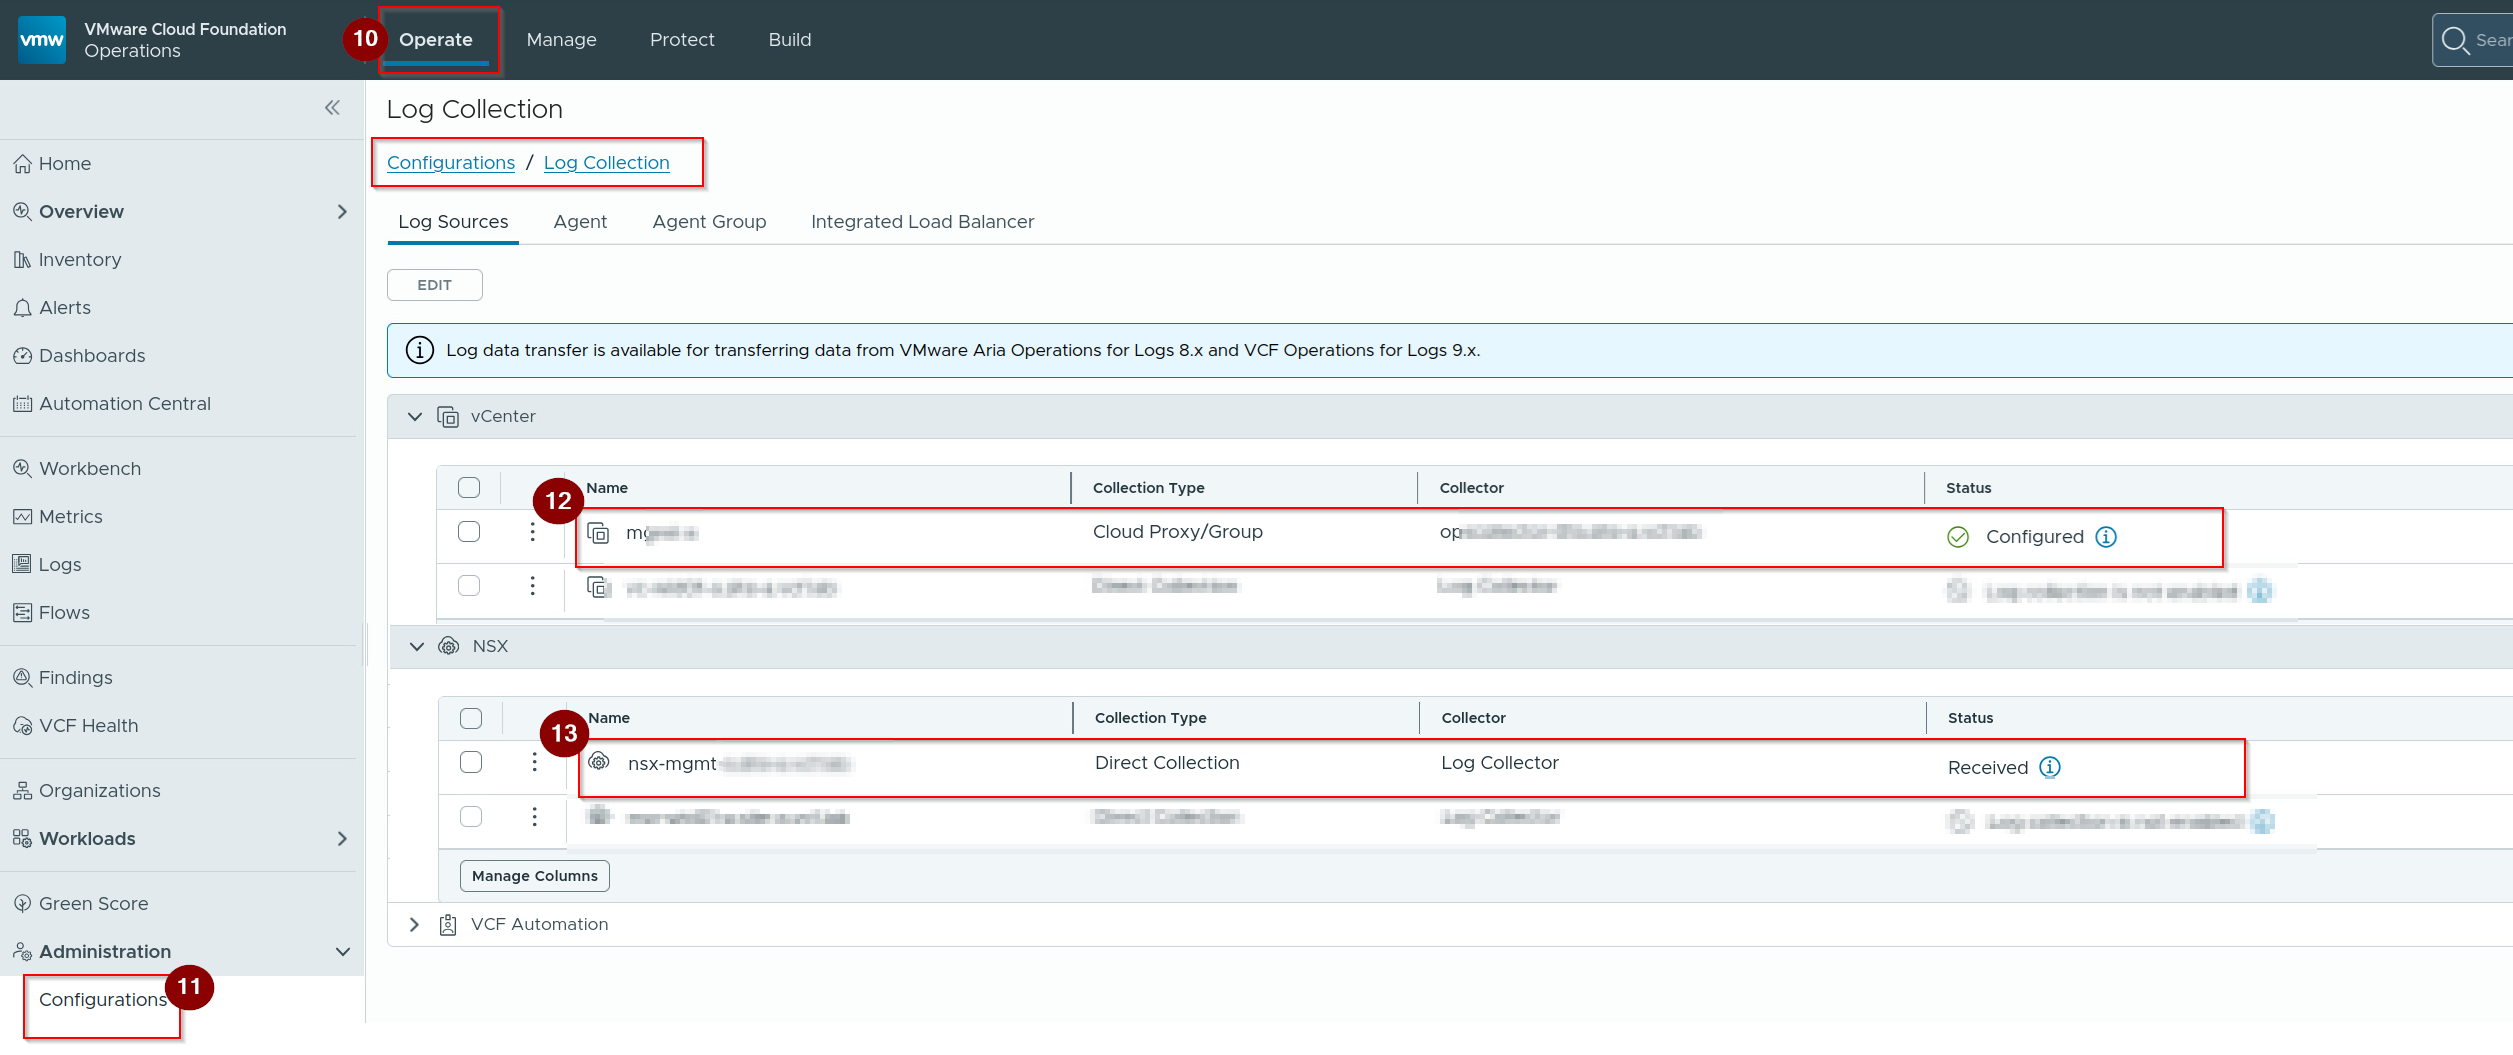
10. Click on Operate.
11. Navigate to Configurations under administration.
12. Under vCenter we can see the status of log is configured.
13. Under NSX we can see the status of log is received.
Phase 3: Cross-Stack Forensic Hunting via OpenSearch
Capture 1: –

- Navigate to the Protect segment in the main menu.
- Select Audit records.
- Locate the upper-right quadrant of the main results table and select the white
LAUNCH AUDIT TRAILbutton. This action switches your active browser session directly into the underlying OpenSearch visualization dashboard.
Capture 2: –
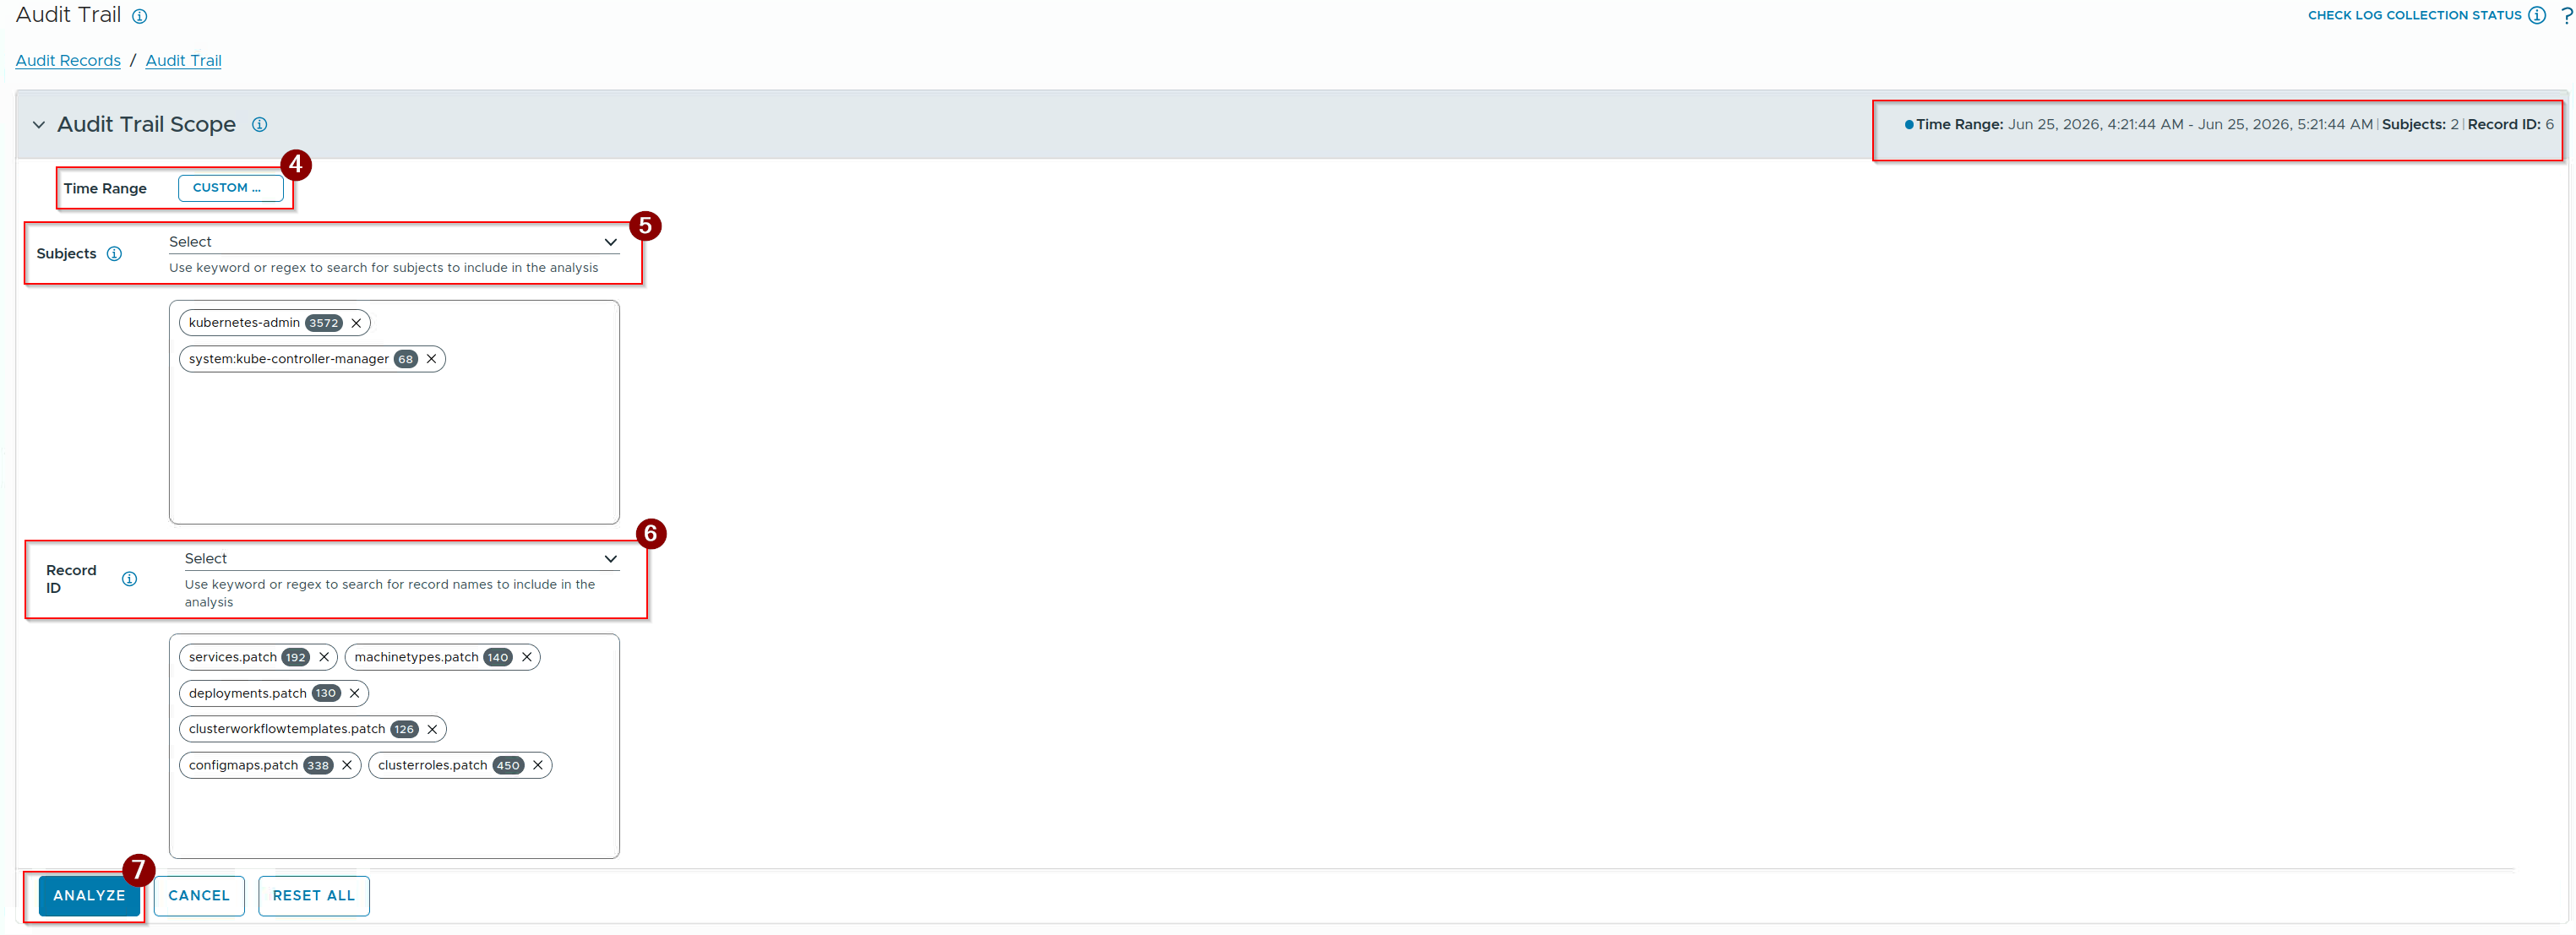
4. Select the time range.
5. Select the Subjects.
Note:- We will give the the keywords or regex to search.
6. Give the record ID.(Which we need to analyse).
7. Click on Analyze.
Capture 3 :-
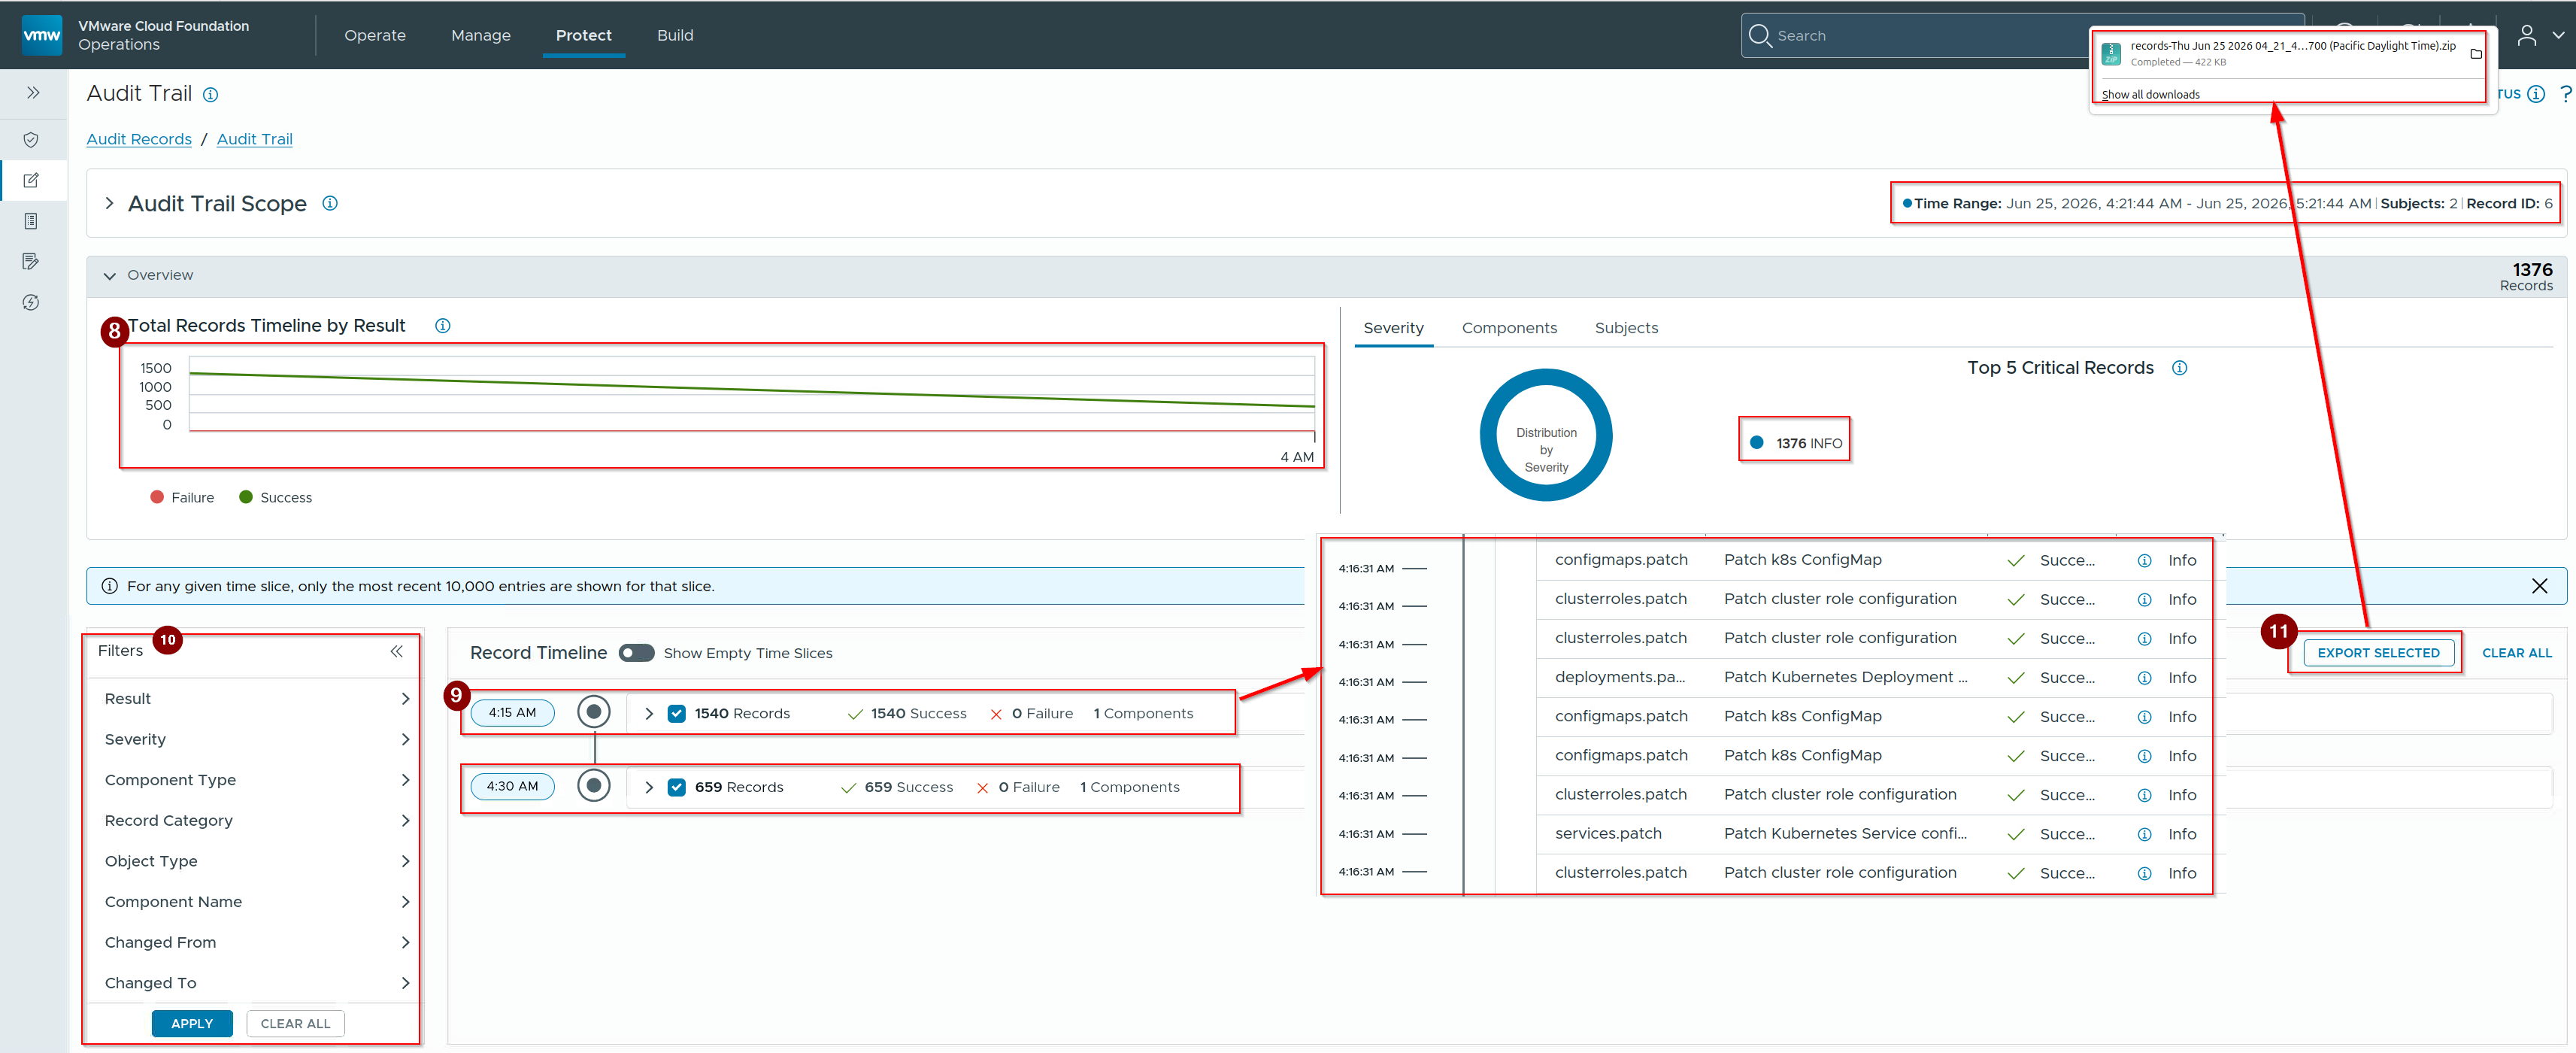
8. We can see the total records timeline in Graph View.
9. We can see the time stamps with records details.
10. If we want to specific information then click on components under Filters and after selection click on apply.
11. If we want to export the logs then click on export selected.
Conclusion
The transition to an embedded OpenSearch engine under the Simple Log Management Model transitions logging from an isolated, external management application into an integrated platform utility. By utilizing hypervisor-level vSphere HA for database resiliency, VCF 9.1 eliminates the computational and operational overhead of independent application clustering. For platform engineers, deep forensic analysis, environmental troubleshooting, and continuous configuration auditing are consolidated natively within the centralized software-defined control plane.
Technical Reference & Next Steps
Official Architecture Reference: For engineers and platform architects planning high-throughput scale-out profiles or geographically distributed environments, cross-reference your production parameters against the official Click Here to evaluate the structural variations between the Simple, High Availability, and Multi-Instance topologies.

Leave a comment